Fig. 8
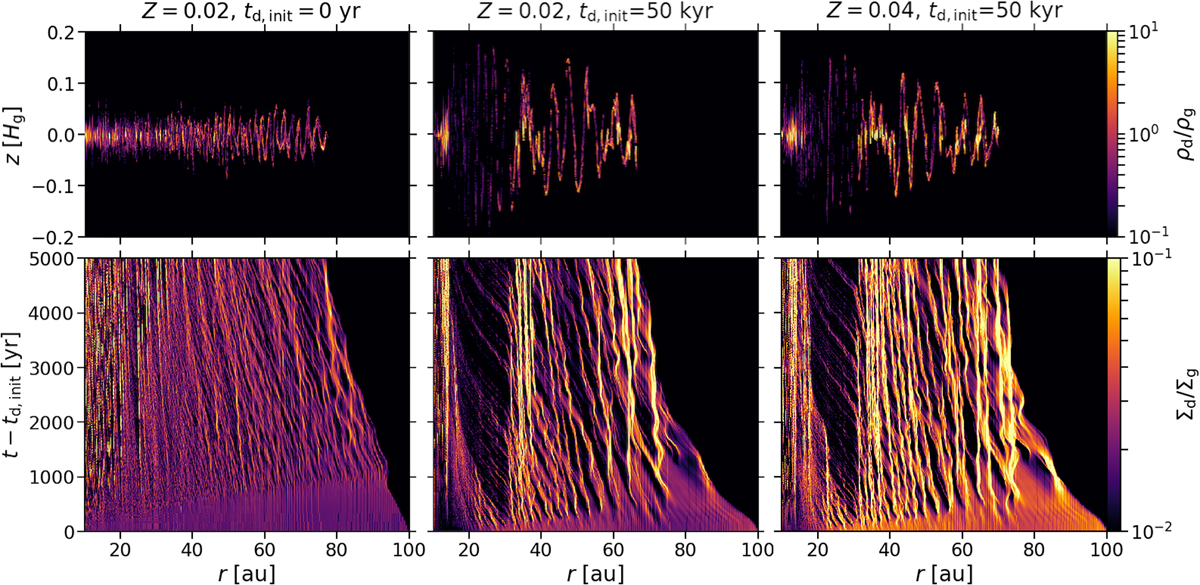
Dust-to-gas volume density ratio ρd∕ρg as a functionof r and z (upper panels) as well as dust-to-gas surface density ratio Σd∕Σg as functions of r and t (lower panels). The upper panels show the spatial dust distribution 5 kyr after the dust initialization. We compare a simulation in which the turbulence in the dust layer is driven by the streaming instability (left panels) and two simulations in which the vertical shear instability is the main source of turbulence (middle and right panels). For the same dust-to-gas surface density ratio of Z =0.02, the dust scale height is smaller, but the radial dust concentration is weaker in the former case. (The values of Z are specified in the titles.) In the latter case, more dust is accumulated in overdensities if the surface density ratio is higher. Some of the accumulations are sufficiently dense for their radial drift to cease almost entirely.
Current usage metrics show cumulative count of Article Views (full-text article views including HTML views, PDF and ePub downloads, according to the available data) and Abstracts Views on Vision4Press platform.
Data correspond to usage on the plateform after 2015. The current usage metrics is available 48-96 hours after online publication and is updated daily on week days.
Initial download of the metrics may take a while.