Fig. 6
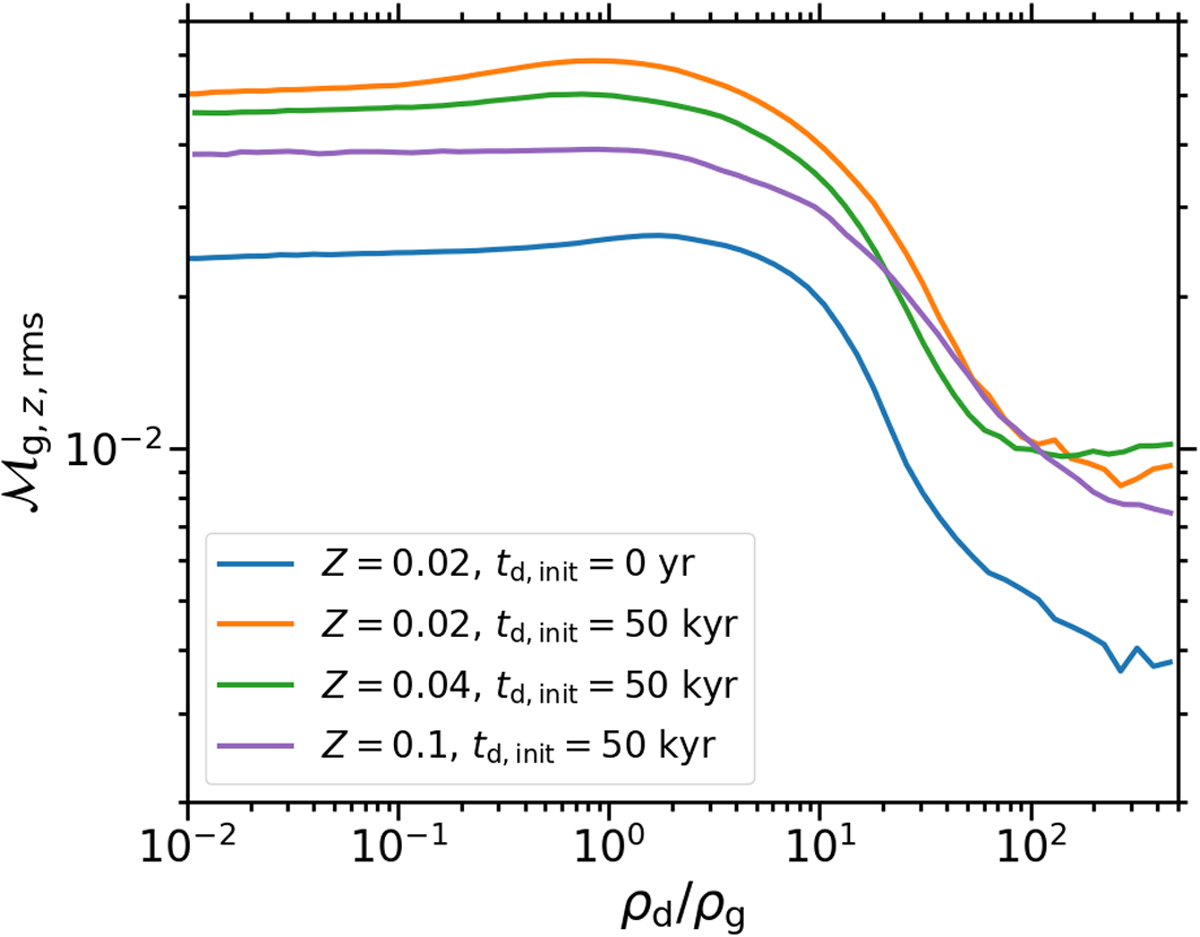
Root mean square of ![]() as a functionof the dust-to-gas density ratio ρd∕ρg. The orange, green, and purple lines represent the turbulent strength in simulations in which we initialize the dust after the vertical shear instability has saturated. The strength at low to intermediate values of the volume density ratio in the three simulations is marginally smaller if the dust-to-gas surface density ratio is greater. Nevertheless, the Mach number is higher in all of these simulations than in the simulation in which we introduce the dust at the start (blue line). We find that the stronger turbulence in the former simulations is driven by the vertical shear instability, while the weaker turbulence in the latter one is caused by the streaming instability. Independent of the source of the turbulence, its strength decreases at dust densities larger than the gas density in all four simulations.
as a functionof the dust-to-gas density ratio ρd∕ρg. The orange, green, and purple lines represent the turbulent strength in simulations in which we initialize the dust after the vertical shear instability has saturated. The strength at low to intermediate values of the volume density ratio in the three simulations is marginally smaller if the dust-to-gas surface density ratio is greater. Nevertheless, the Mach number is higher in all of these simulations than in the simulation in which we introduce the dust at the start (blue line). We find that the stronger turbulence in the former simulations is driven by the vertical shear instability, while the weaker turbulence in the latter one is caused by the streaming instability. Independent of the source of the turbulence, its strength decreases at dust densities larger than the gas density in all four simulations.
Current usage metrics show cumulative count of Article Views (full-text article views including HTML views, PDF and ePub downloads, according to the available data) and Abstracts Views on Vision4Press platform.
Data correspond to usage on the plateform after 2015. The current usage metrics is available 48-96 hours after online publication and is updated daily on week days.
Initial download of the metrics may take a while.