Fig. 4
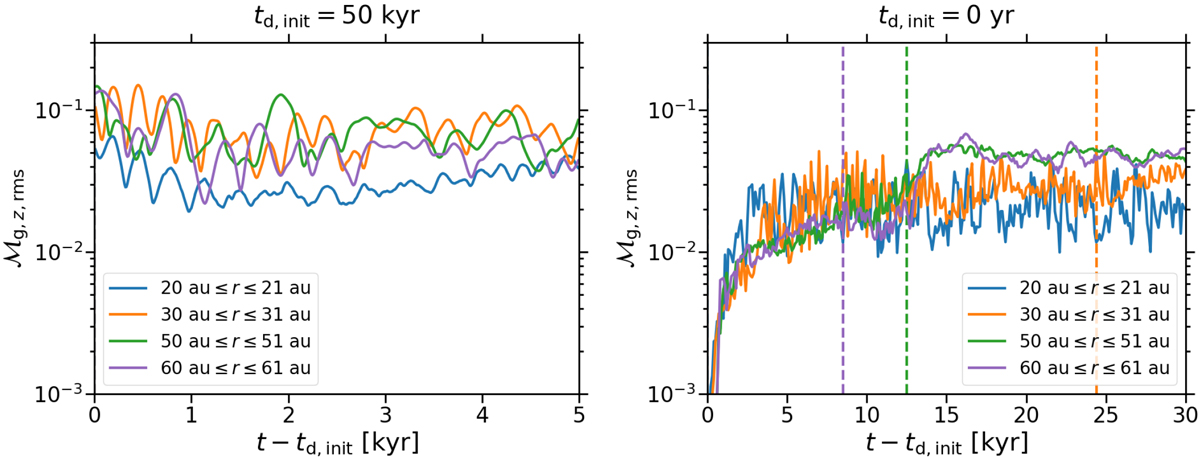
Root mean square of ![]() , averaged over the vertical domain extent and the radii given in the legend, as a function of t after the initialization of the dust at td,init. The mean is weighted by mass, i.e., more weight is assigned to the Mach number in the midplane than to the one away from it. In the simulation iso_Z=0.02_Lr=90au_Lz=4Hg_tdinit=50kyr (left panel), the vertical shear instability has saturated before the dust is introduced. The Mach number remains approximately constant at a value
, averaged over the vertical domain extent and the radii given in the legend, as a function of t after the initialization of the dust at td,init. The mean is weighted by mass, i.e., more weight is assigned to the Mach number in the midplane than to the one away from it. In the simulation iso_Z=0.02_Lr=90au_Lz=4Hg_tdinit=50kyr (left panel), the vertical shear instability has saturated before the dust is introduced. The Mach number remains approximately constant at a value ![]() after the dust initialization (compare with Fig. 2). That is, in this simulation the vertical shear instability is the primary source of turbulence in the midplane. In contrast, in the simulation iso_Z=0.02_Lr=90au_Lz=4Hg (right panel), in which the vertical shear instability and the streaming instability begin to grow at the same time, the Mach number saturates at a lower value of
after the dust initialization (compare with Fig. 2). That is, in this simulation the vertical shear instability is the primary source of turbulence in the midplane. In contrast, in the simulation iso_Z=0.02_Lr=90au_Lz=4Hg (right panel), in which the vertical shear instability and the streaming instability begin to grow at the same time, the Mach number saturates at a lower value of ![]() . After no dust remains at a radius because of its radial drift (this point is marked with a dashed line), the Mach number increases until it is approximately equal to the value at the same radius in the simulation iso_Z=0.02_Lr=90au_Lz=4Hg_tdinit=50kyr. We find that, as long as dust is present, the streaming instability drives the turbulence in the midplane in the simulation iso_Z=0.02_Lr=90au_Lz=4Hg.
. After no dust remains at a radius because of its radial drift (this point is marked with a dashed line), the Mach number increases until it is approximately equal to the value at the same radius in the simulation iso_Z=0.02_Lr=90au_Lz=4Hg_tdinit=50kyr. We find that, as long as dust is present, the streaming instability drives the turbulence in the midplane in the simulation iso_Z=0.02_Lr=90au_Lz=4Hg.
Current usage metrics show cumulative count of Article Views (full-text article views including HTML views, PDF and ePub downloads, according to the available data) and Abstracts Views on Vision4Press platform.
Data correspond to usage on the plateform after 2015. The current usage metrics is available 48-96 hours after online publication and is updated daily on week days.
Initial download of the metrics may take a while.