Fig. B.1
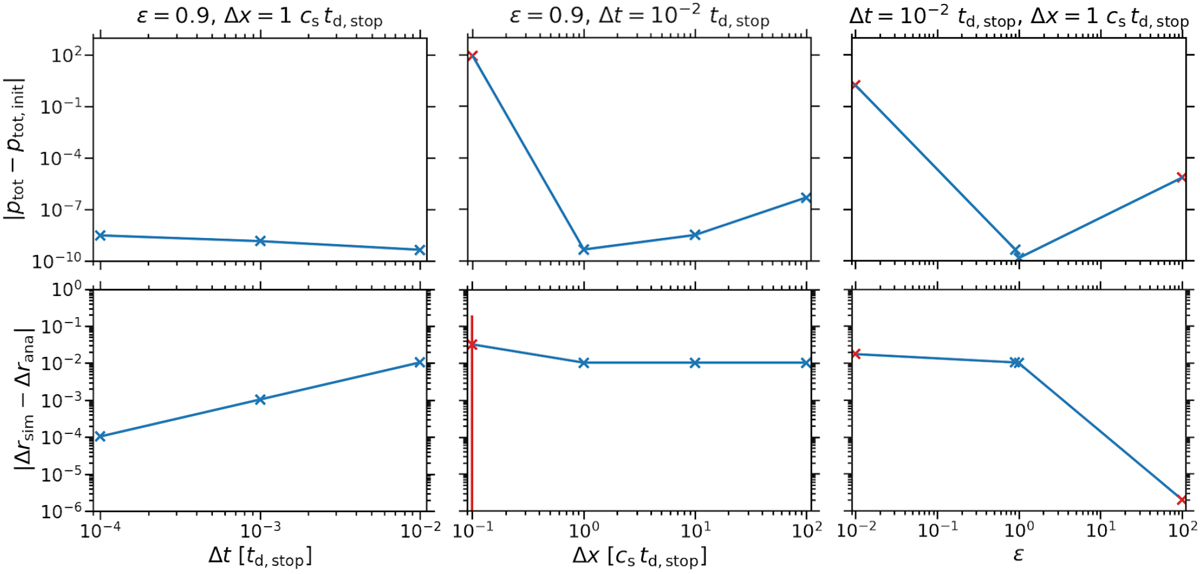
Absolute error of the total momentum ptot of dust and gas relative to the initial total momentum ptot, init (upper panels) and mean absolute error of the simulated particle displacement Δrsim with respect to the analytic solution Δrana (see Eq. (B.7); lower panels). In the latter case, the mean is calculated by averaging over all particles, with the standard deviations plotted as error bars. (With one exception, the standard deviations are too small for the error bars to be visible, though.) Both the momentum and the displacement errors are computed after 3 td,stop. We show the errors as functions of the time-step Δt (left panels),of the grid cell edge length Δx (middle panels), and of the dust-to-gas density ratio ϵ (right panels). In the title of every column of panels, the fixed values of the other two quantities are given. Simulations in which particles cross the domain boundaries are marked with red crosses. The error in the total momentum can exceed one in these simulations, but is in general of the order of 10−10 to 10−9 otherwise. The error in the displacement increases linearly with the time-step since our drag algorithm is first-order accurate. On the other hand, it is independent of the cell size for sizes of at least 1 cs td,stop. At these resolutions, the particles are displaced by less than half a cell within 3 td,stop and therefore do not transverse the boundaries. The error for the fiducial dust-to-gas density ratio of ϵ = 0.9 amounts to 10−2; while for a ratio of ϵ = 0.01 it is greater by a factor of a few, it is as small as ~10−6 if the ratio is equal to ϵ = 100. This is despite a number of particles crossing the boundaries if the density ratio is much less or much greater than the fiducial value.
Current usage metrics show cumulative count of Article Views (full-text article views including HTML views, PDF and ePub downloads, according to the available data) and Abstracts Views on Vision4Press platform.
Data correspond to usage on the plateform after 2015. The current usage metrics is available 48-96 hours after online publication and is updated daily on week days.
Initial download of the metrics may take a while.