Fig. 12
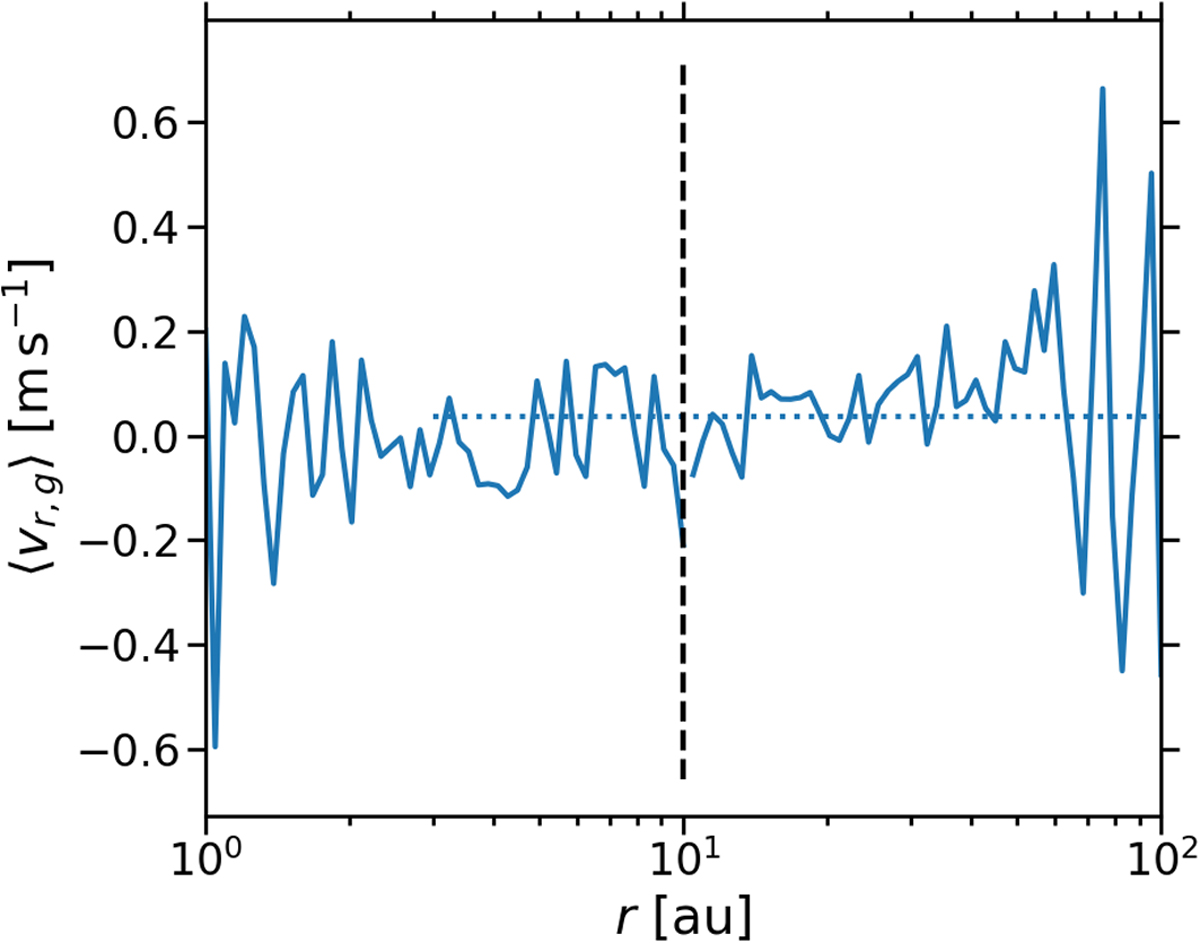
Radial gas velocity (solid line) as a function of r in the simulations adi_Z=0.02_Lr=9au and adi_Z=0.02_Lr=90au. (The dashed lines marks the boundary between the domains of the two simulations.) The velocity is computed as the mass-weighted average over the vertical domain extent and a time-span of 50 and 500 yr, respectively,after an equilibrium dust scale height has been attained in each simulation. The average radial velocity at r ≥ 3 au is plotted as a dotted line and amounts to 0.035 m s−1. This outward motion is caused by the dust drifting radially inwards and its angular momentum being transferred to the gas. However, it is evident that the mean of the velocity is less than its standard deviation, which is equal to 0.16 m s−1. This is a result of the turbulent motions caused by the streaming instability.
Current usage metrics show cumulative count of Article Views (full-text article views including HTML views, PDF and ePub downloads, according to the available data) and Abstracts Views on Vision4Press platform.
Data correspond to usage on the plateform after 2015. The current usage metrics is available 48-96 hours after online publication and is updated daily on week days.
Initial download of the metrics may take a while.