Fig. 4.
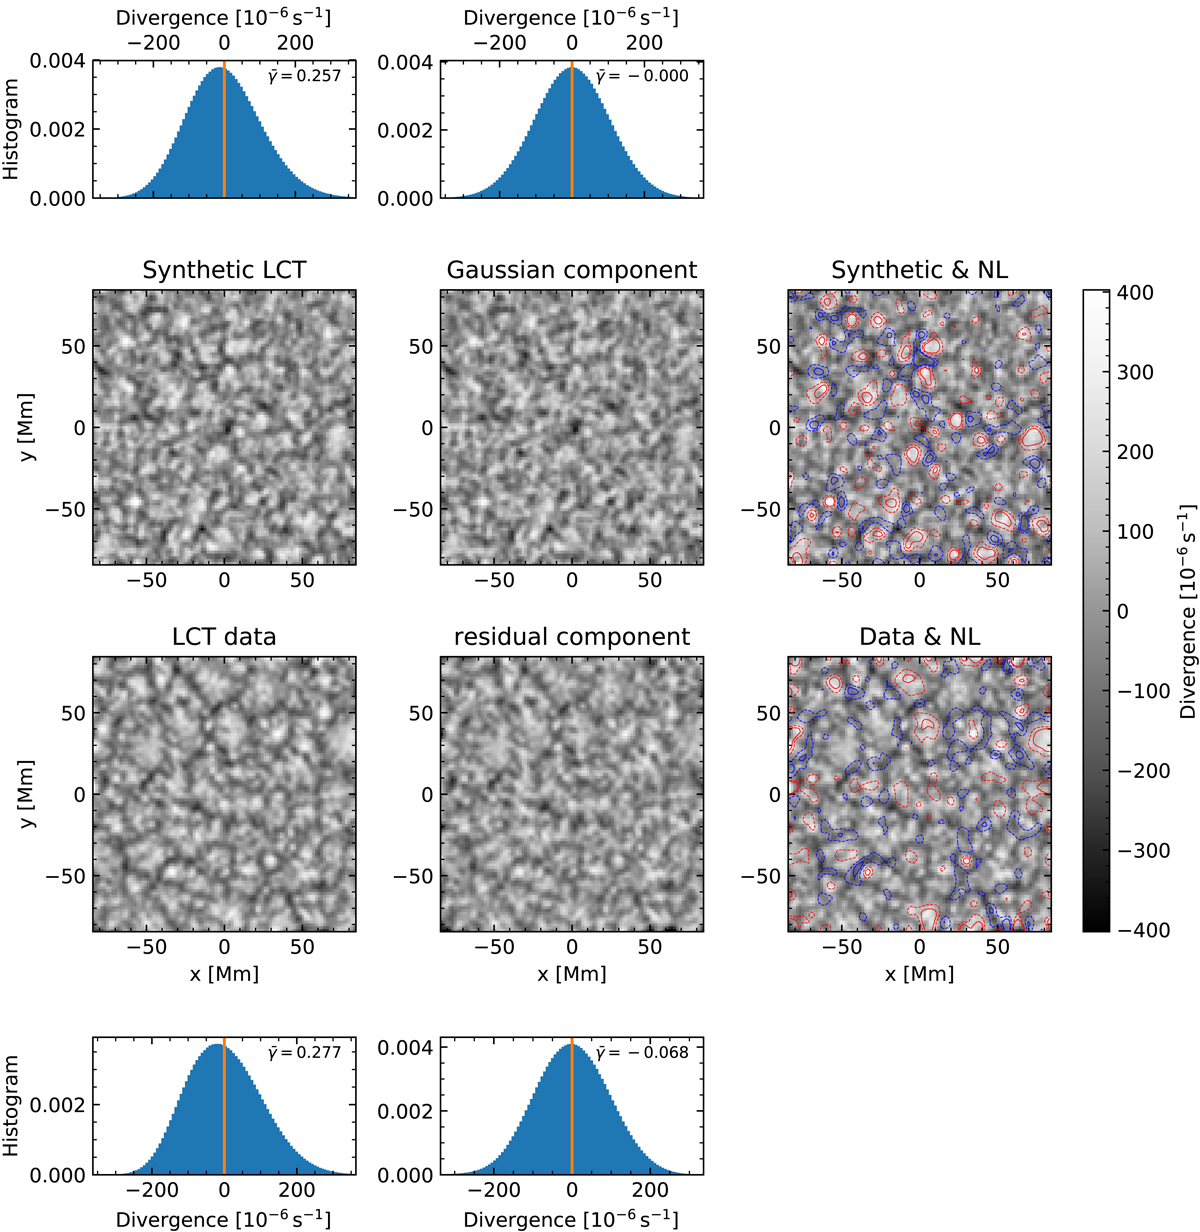
Example synthetic data (top two rows) generated from the measured bispectrum and example LCT data (bottom two rows). The different columns are the (synthetic or real) data (left), contours of the estimated quadratic nonlinear component overplotted over the data (right), the residual after subtracting the estimated nonlinear component from the data (middle column, two bottom rows), and the Gaussian field from which the synthetic data were generated (middle column, top two rows). Contour lines in the right column indicate levels of ±1σXNL (dashed) and ±2σXNL (solid) of the nonlinear component (positive: red, negative: blue). In addition, the skewness is given in the corresponding histogram; both were computed from the entire dataset. See Fig. F.5 for the corresponding TD results.
Current usage metrics show cumulative count of Article Views (full-text article views including HTML views, PDF and ePub downloads, according to the available data) and Abstracts Views on Vision4Press platform.
Data correspond to usage on the plateform after 2015. The current usage metrics is available 48-96 hours after online publication and is updated daily on week days.
Initial download of the metrics may take a while.