Fig. 8
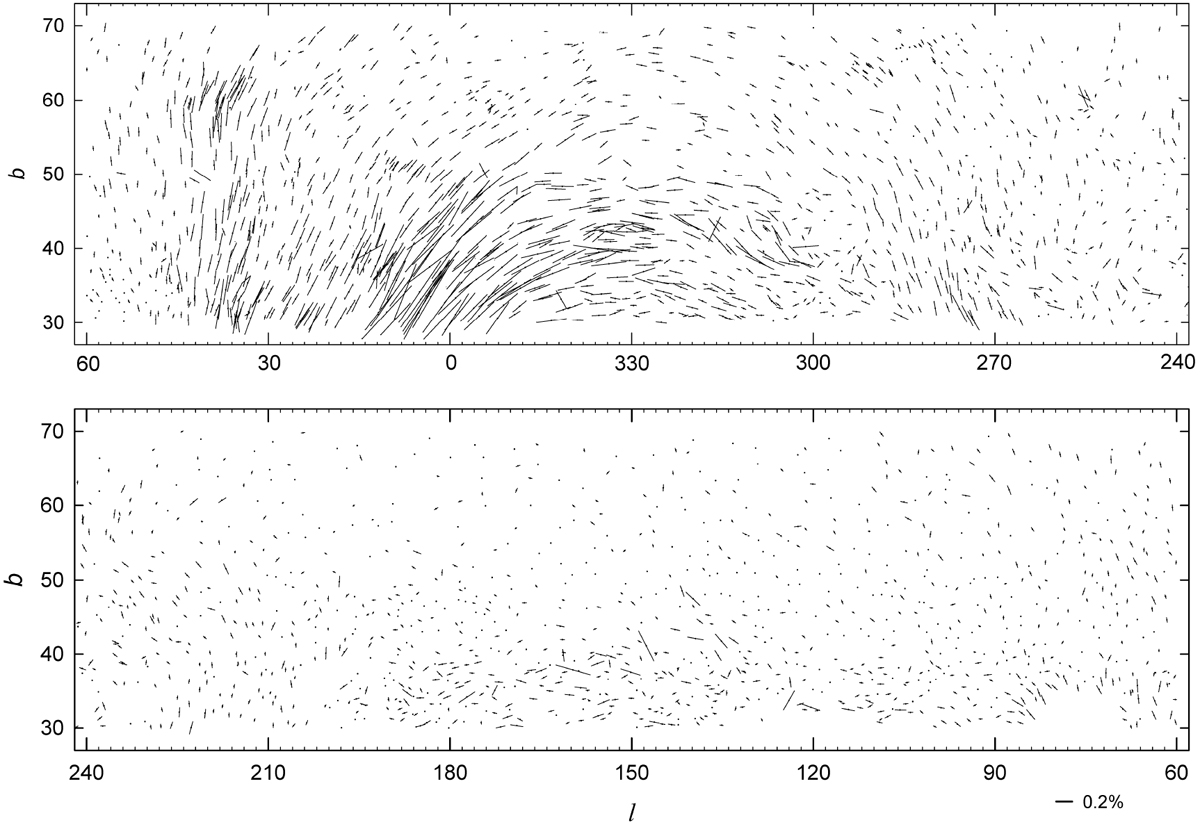
Polarization map of northern Galactic latitude stars in the distance range 100 pc < d < 500 pc. We note that the polarization scale is compressed by a factor of ~70 compared with that in Fig. 7, and only stars with b > 30° are plotted (from Berdyugin et al. 2014).
Current usage metrics show cumulative count of Article Views (full-text article views including HTML views, PDF and ePub downloads, according to the available data) and Abstracts Views on Vision4Press platform.
Data correspond to usage on the plateform after 2015. The current usage metrics is available 48-96 hours after online publication and is updated daily on week days.
Initial download of the metrics may take a while.