Fig. 4
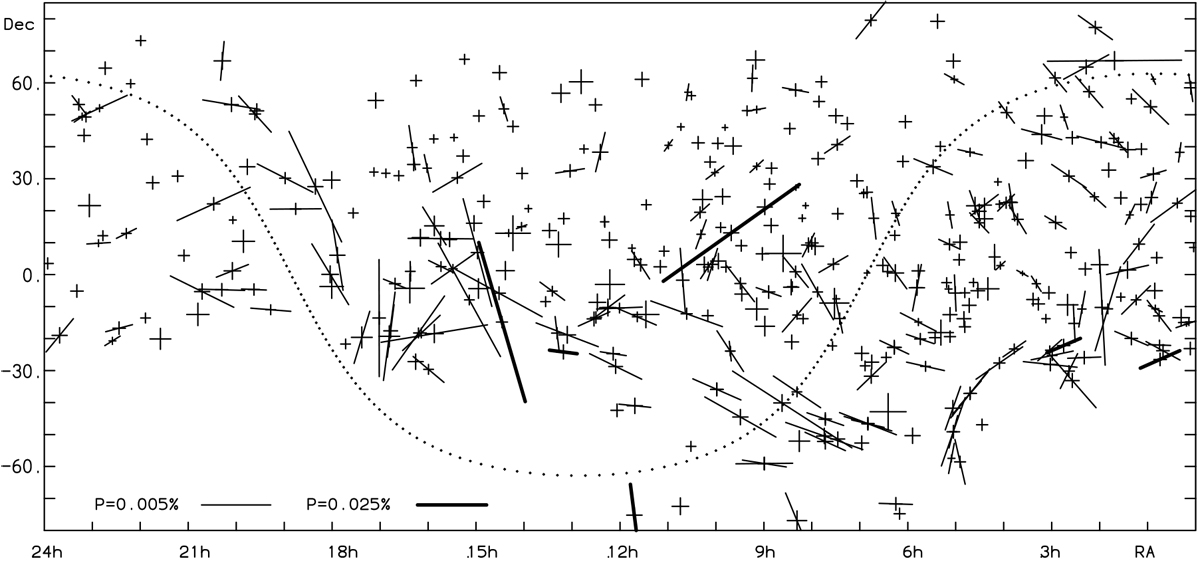
Polarization map based on the sample of nearby stars (d < 50 pc), plotted in Equatorial coordinates. Two different polarization scales are used for clarity, as indicated in the bottom of the panel. For low observed degrees of polarization, p < 2σ (no detection), only a cross with bar lengths, σ, is plotted. The dotted line shows the Galactic equator.
Current usage metrics show cumulative count of Article Views (full-text article views including HTML views, PDF and ePub downloads, according to the available data) and Abstracts Views on Vision4Press platform.
Data correspond to usage on the plateform after 2015. The current usage metrics is available 48-96 hours after online publication and is updated daily on week days.
Initial download of the metrics may take a while.