Fig. 3
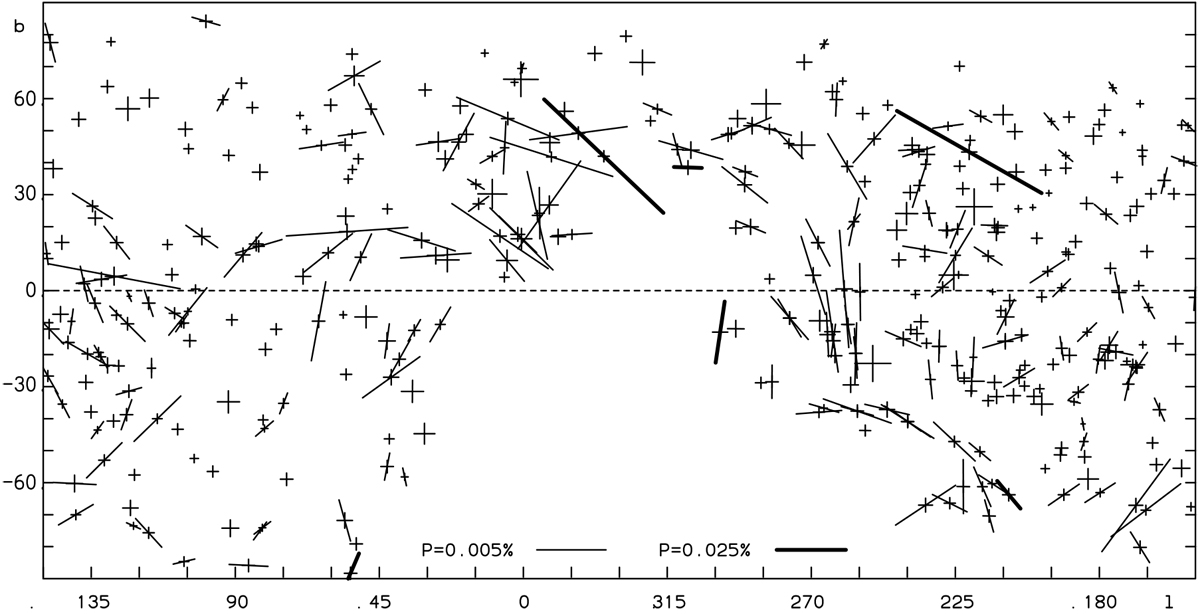
Polarization map based on the observed sample of nearby stars (d < 50 pc), plotted in Galactic coordinates. The length of the bars is proportional to the degree of polarization and the orientation gives the direction of the maximum electric vector. Regions with aligned polarization vectors can be seen, suggesting filament-type structures. Two different polarization scales are used for clarity, as indicated in the bottom of the panel. For low observed degrees of polarization, p < 2σ (no detection), only a cross with bar lengths, σ, is plotted.
Current usage metrics show cumulative count of Article Views (full-text article views including HTML views, PDF and ePub downloads, according to the available data) and Abstracts Views on Vision4Press platform.
Data correspond to usage on the plateform after 2015. The current usage metrics is available 48-96 hours after online publication and is updated daily on week days.
Initial download of the metrics may take a while.