Fig. 1.
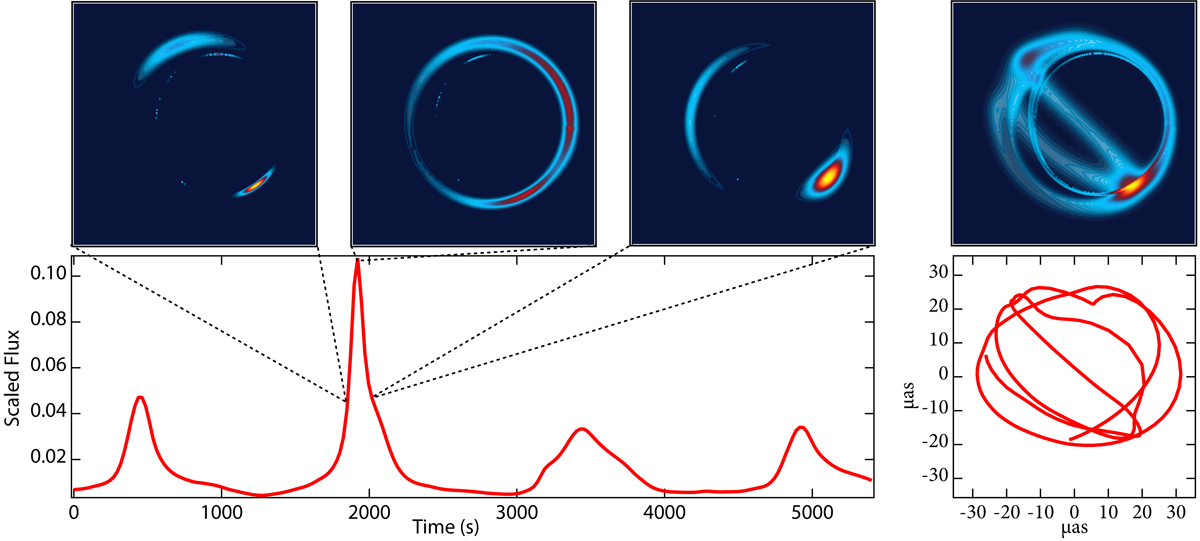
Sample image of a hotspot at different points in the orbit. Top row: image of the hotspot before, during, and after a strong lensing event. Top-right plot: image averaged over the whole orbit. Lower left panel: lightcurve produced over several orbits, lower right panel: motion of the centroid of emission. This figure was produced with a hotspot in a circular orbit at R = 5M around a black hole with spin a = 0.9. The spin axis of the black hole is inclined i = 15° from the observer’s line of sight and the relative inclination between the spin axis and the orbital plane is θ = 50.54°.
Current usage metrics show cumulative count of Article Views (full-text article views including HTML views, PDF and ePub downloads, according to the available data) and Abstracts Views on Vision4Press platform.
Data correspond to usage on the plateform after 2015. The current usage metrics is available 48-96 hours after online publication and is updated daily on week days.
Initial download of the metrics may take a while.