Fig. 14.
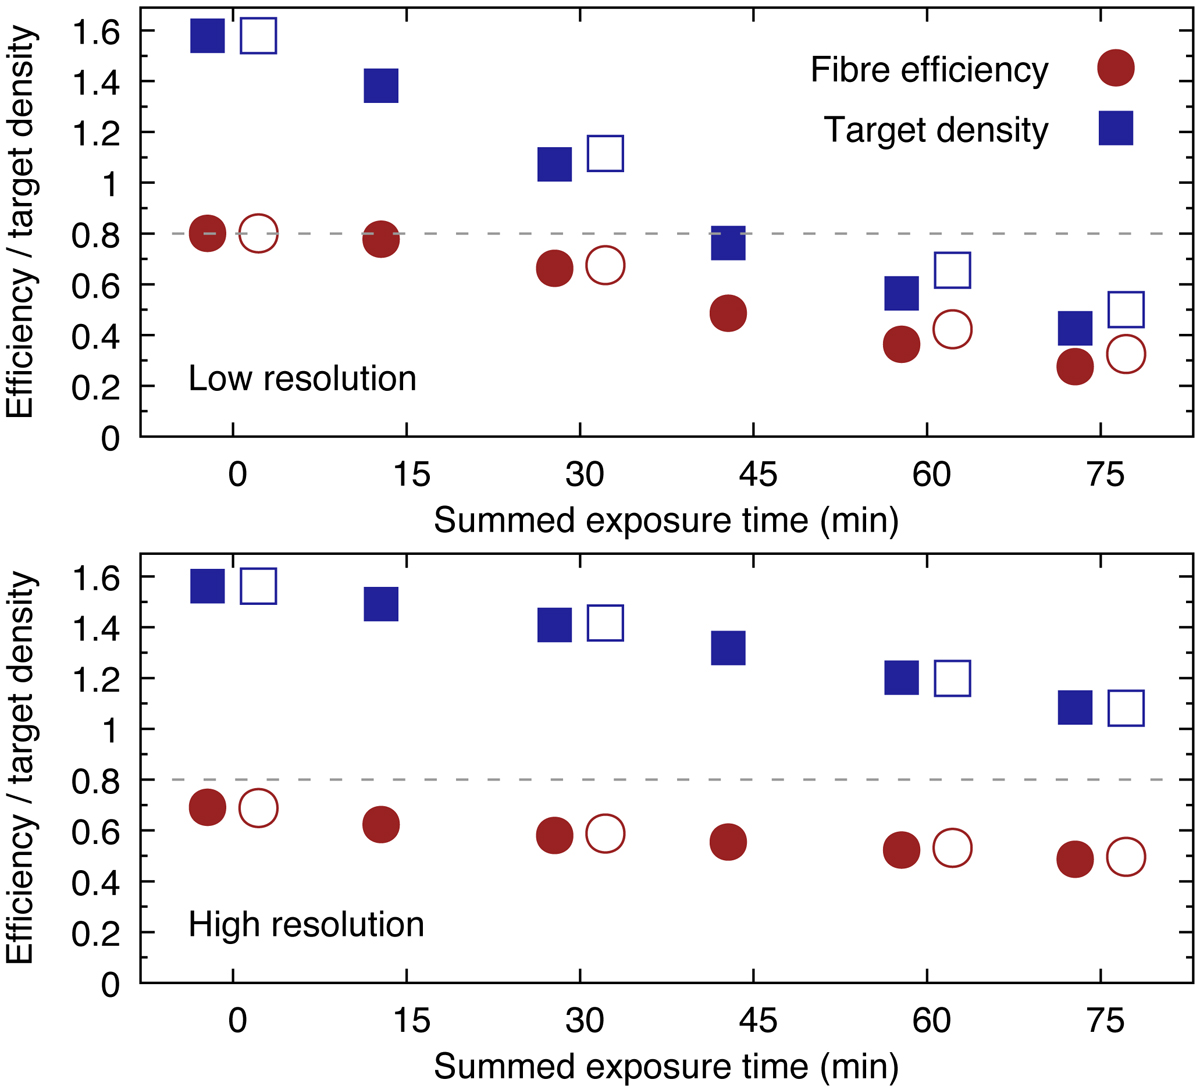
Fibre usage efficiency (red circles) for low- (upper panel) and high-resolution (lower panel) surveys as a function of survey progress. For both resolutions, we used only 80% of fibres for science targets, where the rest of the fibres were reserved for standard stars and the sky background. Hence the maximum fibre efficiency is 0.8. Blue squares show the mean target density on the sky normalised by the number density of science fibres. At the beginning of the survey, the target density exceeds the fibre density by two times, but for the last exposures the target density in the low-resolution regime is lower (less than 1.0) than the fibre density. Hence, for the last exposures we do not have enough targets to fill all fibres. Filled points represent the base simulation (15 min exposure six times) and empty points indicate the simulation with four visits (30 min twice plus 15 min twice).
Current usage metrics show cumulative count of Article Views (full-text article views including HTML views, PDF and ePub downloads, according to the available data) and Abstracts Views on Vision4Press platform.
Data correspond to usage on the plateform after 2015. The current usage metrics is available 48-96 hours after online publication and is updated daily on week days.
Initial download of the metrics may take a while.