Free Access
Fig. 12.
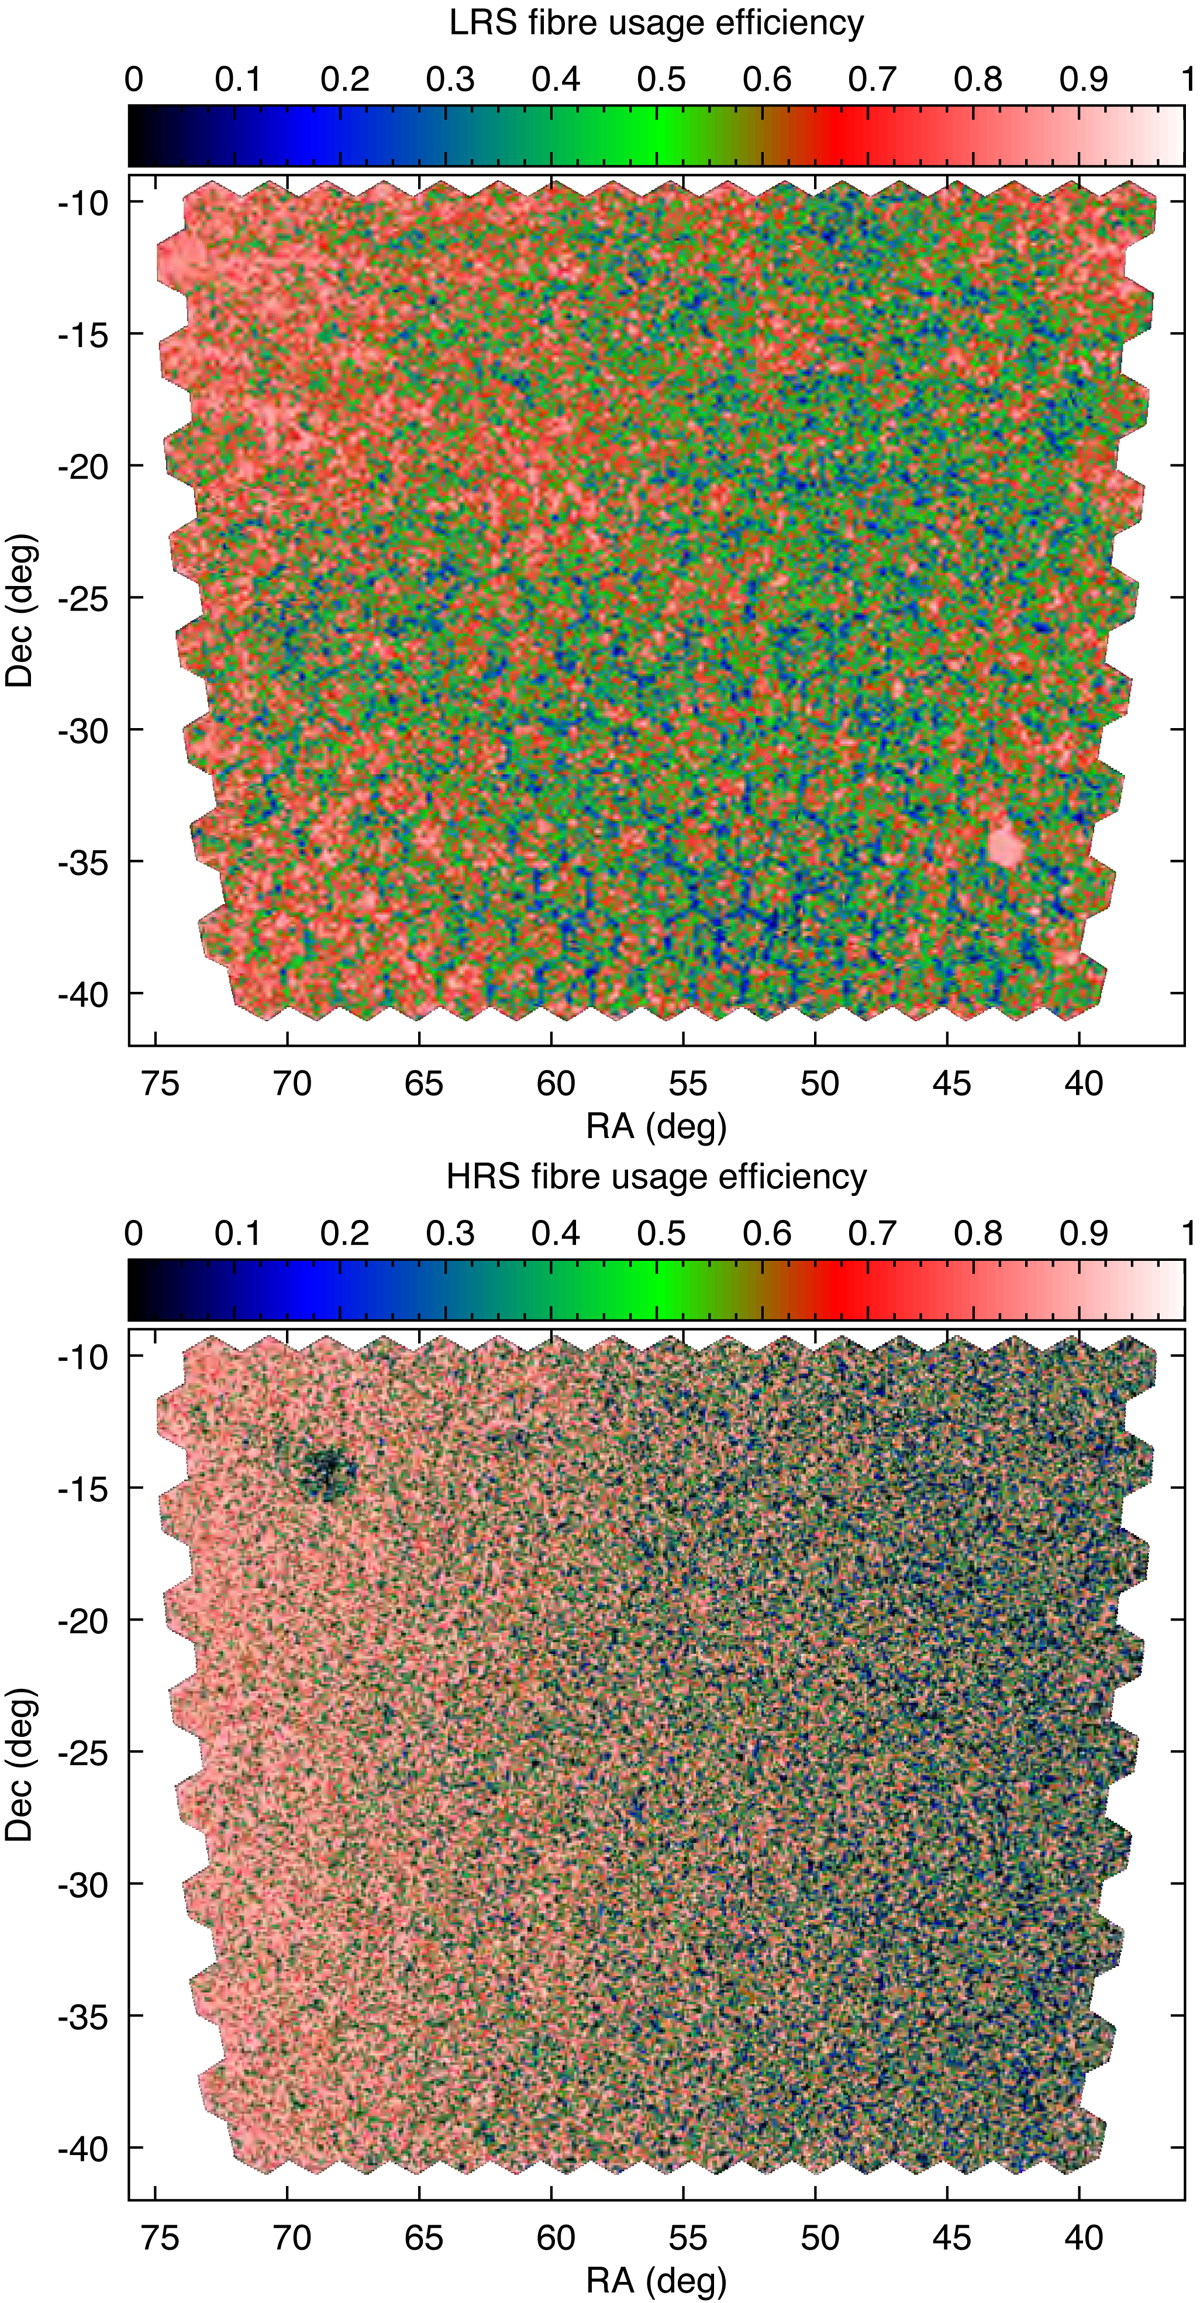
Fibre usage efficiency for low- (upper panel) and high-resolution (lower panel) surveys. The visible gradient from left to right is due to the fixed tiling and varying number density of objects (see Fig. 9).
Current usage metrics show cumulative count of Article Views (full-text article views including HTML views, PDF and ePub downloads, according to the available data) and Abstracts Views on Vision4Press platform.
Data correspond to usage on the plateform after 2015. The current usage metrics is available 48-96 hours after online publication and is updated daily on week days.
Initial download of the metrics may take a while.