Fig. 8.
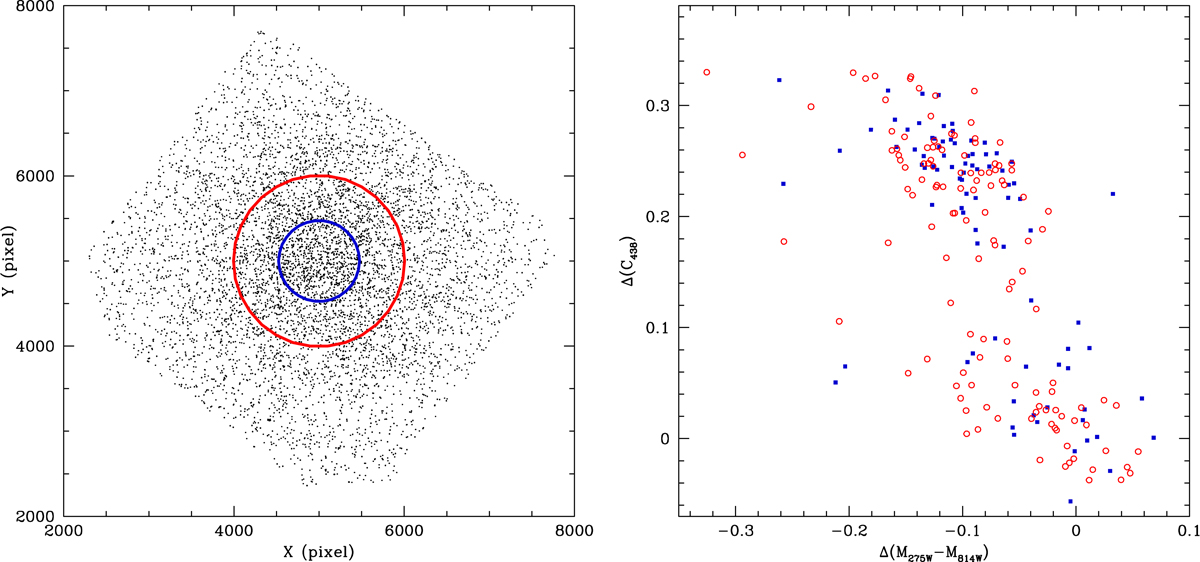
Left panel: position of stars brighter than m814W = 18.5 in the cluster NGC 6254. The red and blue circles indicate the two regions used to produce the chromosome maps of the right panel. Right panel: chromosome map of the stars inside the blue circle in the left panel (blue squares) and of the stars in between the red and blue circles (open red circles). Only stars brighter than m814W = 16.5 (i.e., above the bottom of the RGB) are considered in the chromosome maps.
Current usage metrics show cumulative count of Article Views (full-text article views including HTML views, PDF and ePub downloads, according to the available data) and Abstracts Views on Vision4Press platform.
Data correspond to usage on the plateform after 2015. The current usage metrics is available 48-96 hours after online publication and is updated daily on week days.
Initial download of the metrics may take a while.