Fig. 4.
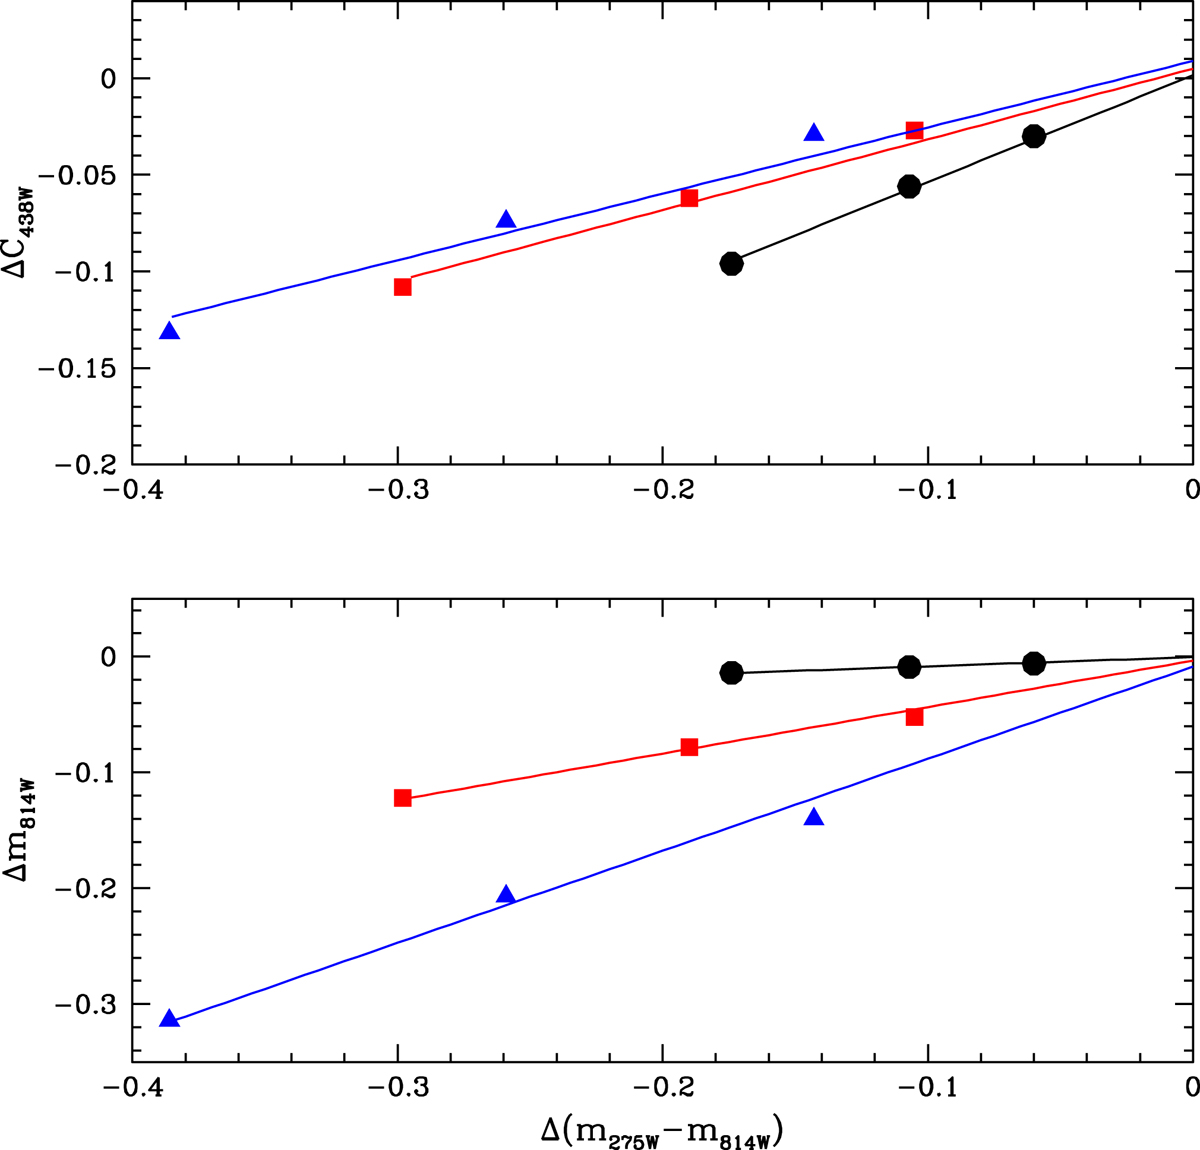
Relation between color correction ΔC438W and Δ(m275W − m814W) (top panel) and Δm814W and Δ(m275W − m814W) (bottom panel) resulting from binarity for Y = 0.248 stars. Each symbol corresponds to a combination of spectra as described in Sect. 3.1 and shown in Fig. 3. Each color refers to a given giant star (black: the most luminous giant; red: the intermediate luminosity giant; blue: the giant at the bottom of the RGB), and thus to a given magnitude bin defined in Sect. 3.1. Linear regressions to each set of colored points are shown. For the linear regressions, we also added the point at (0,0) to ensure that all color corrections are negligible in case of low-mass companions. See also, Sect. 3.3.
Current usage metrics show cumulative count of Article Views (full-text article views including HTML views, PDF and ePub downloads, according to the available data) and Abstracts Views on Vision4Press platform.
Data correspond to usage on the plateform after 2015. The current usage metrics is available 48-96 hours after online publication and is updated daily on week days.
Initial download of the metrics may take a while.