Open Access
Fig. 3.
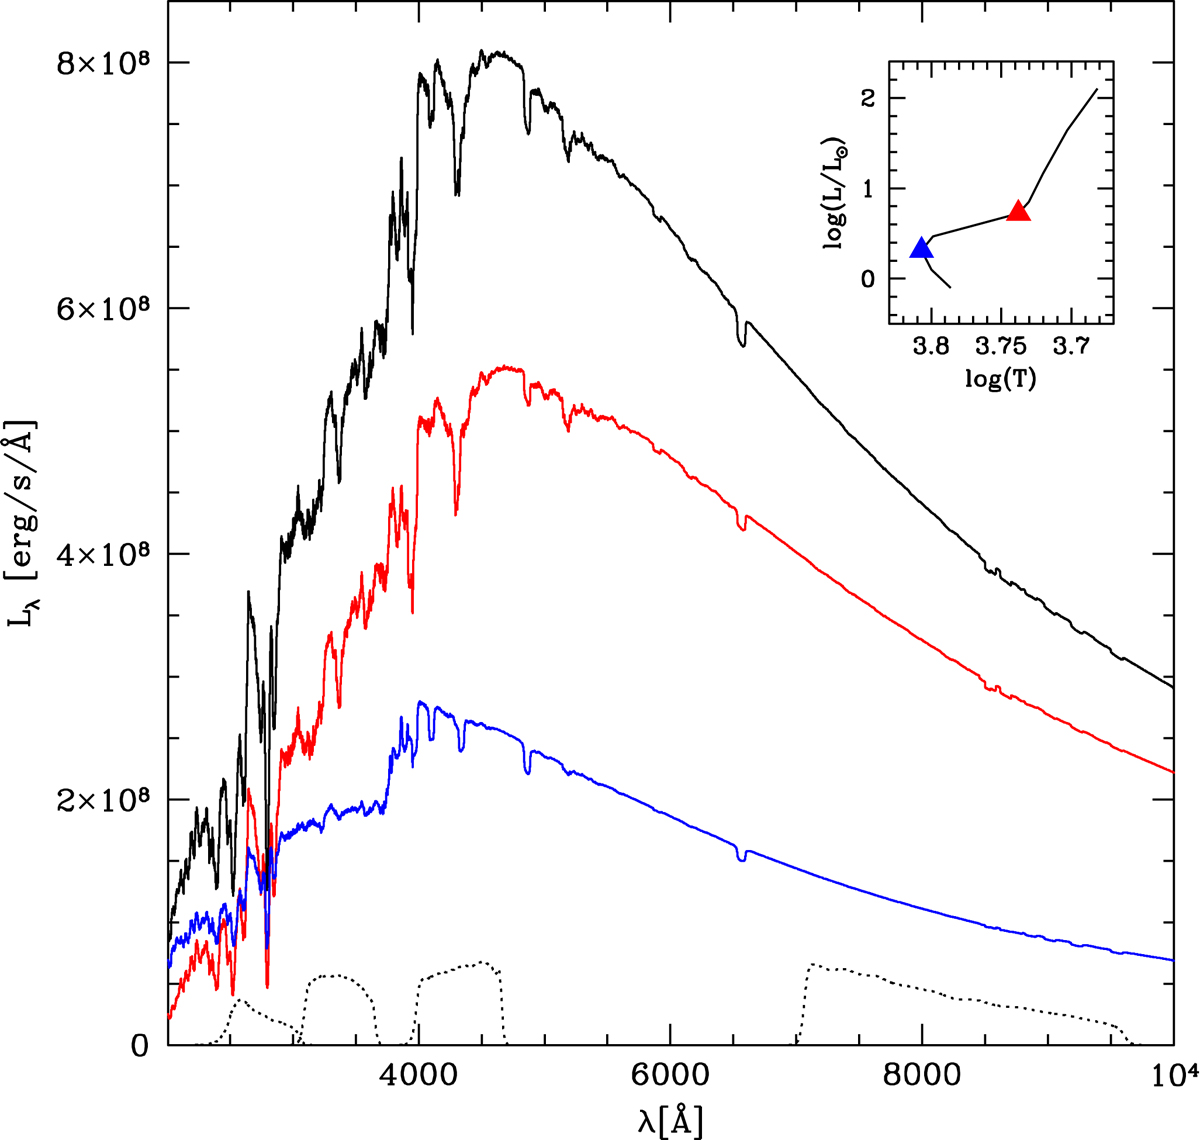
Composite spectrum (black line) made of one low-luminosity RGB (red line) and one turn-off (blue) star of the Y = 0.248 isochrone. The HRD in the insert shows the position of the two stars (filled triangles) along the Y = 0.248 isochrone. The dotted lines show the HST filters throughputs (F275W, F336W, F438W, and F814W).
Current usage metrics show cumulative count of Article Views (full-text article views including HTML views, PDF and ePub downloads, according to the available data) and Abstracts Views on Vision4Press platform.
Data correspond to usage on the plateform after 2015. The current usage metrics is available 48-96 hours after online publication and is updated daily on week days.
Initial download of the metrics may take a while.