Fig. 2.
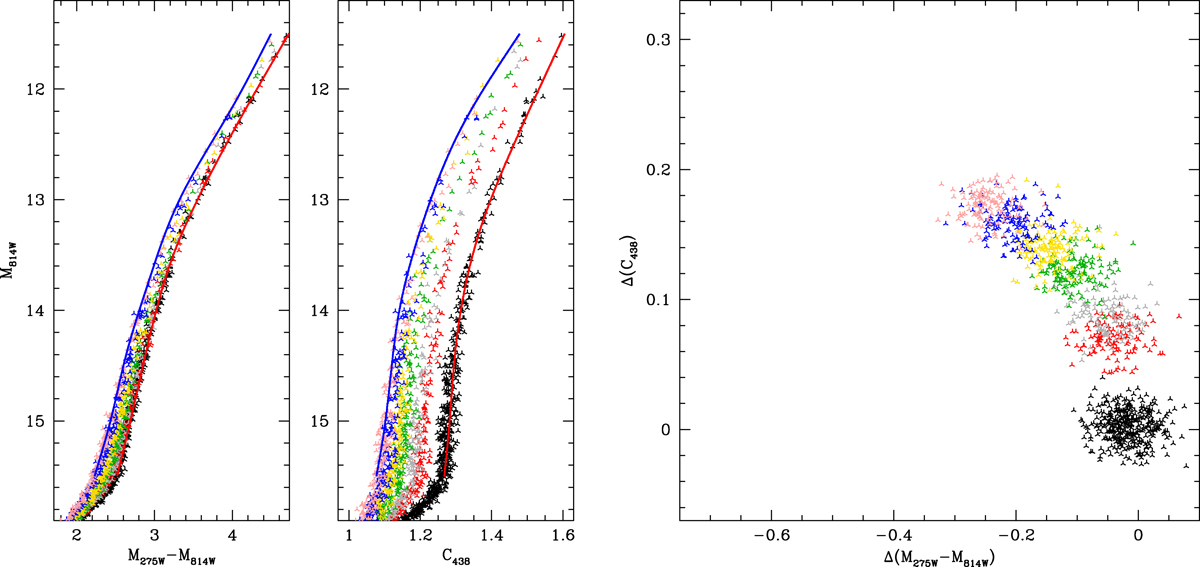
Left and middle panels: magnitude in the F814W filter as a function of the magnitude difference in the F275W and F814W filters (left) and the color index C438W (middle). The symbols denote the stars in the synthetic cluster. The red and blue lines in each panel are the fiducial lines used to calculate color differences in the chromosome map. Right panel: chromosome map. For clarity, the different populations are color-coded according to their initial chemical composition. Colors are the same as in Fig. 1.
Current usage metrics show cumulative count of Article Views (full-text article views including HTML views, PDF and ePub downloads, according to the available data) and Abstracts Views on Vision4Press platform.
Data correspond to usage on the plateform after 2015. The current usage metrics is available 48-96 hours after online publication and is updated daily on week days.
Initial download of the metrics may take a while.