Fig. 17.
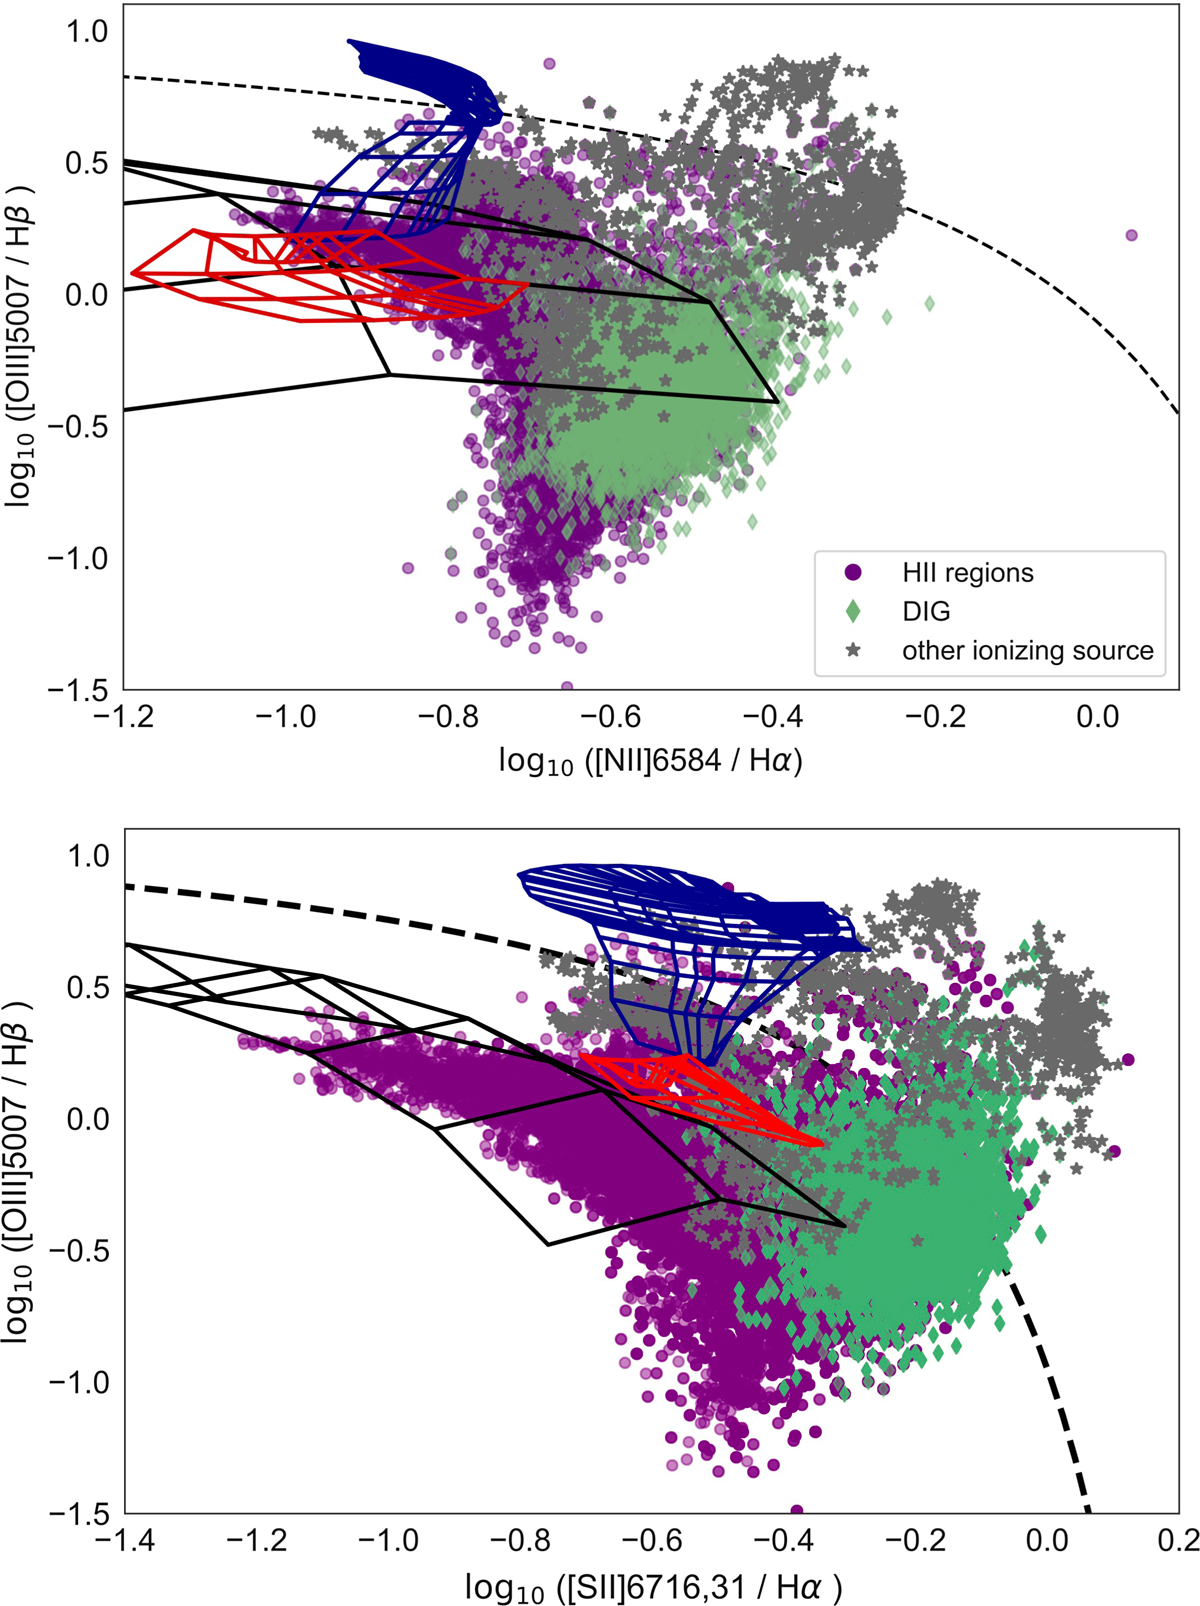
[NII]- and [SII]-BPT diagrams with each spaxel colour-coded based on its spatial location: inside an HII region (purple circles), a region ionised by another source (grey stars) or in the DIG (green diamonds). Observations are compared with fast radiative shock models from Allen et al. (2008) (shock only models for vshock < 200 in red; shock+precursor models for vshock > 200 in dark blue) and models of star forming galaxies from Levesque et al. (2010) (solid black). The black dashed line shows for reference the extreme starburst line from Kewley et al. (2001).
Current usage metrics show cumulative count of Article Views (full-text article views including HTML views, PDF and ePub downloads, according to the available data) and Abstracts Views on Vision4Press platform.
Data correspond to usage on the plateform after 2015. The current usage metrics is available 48-96 hours after online publication and is updated daily on week days.
Initial download of the metrics may take a while.