Fig. 7.
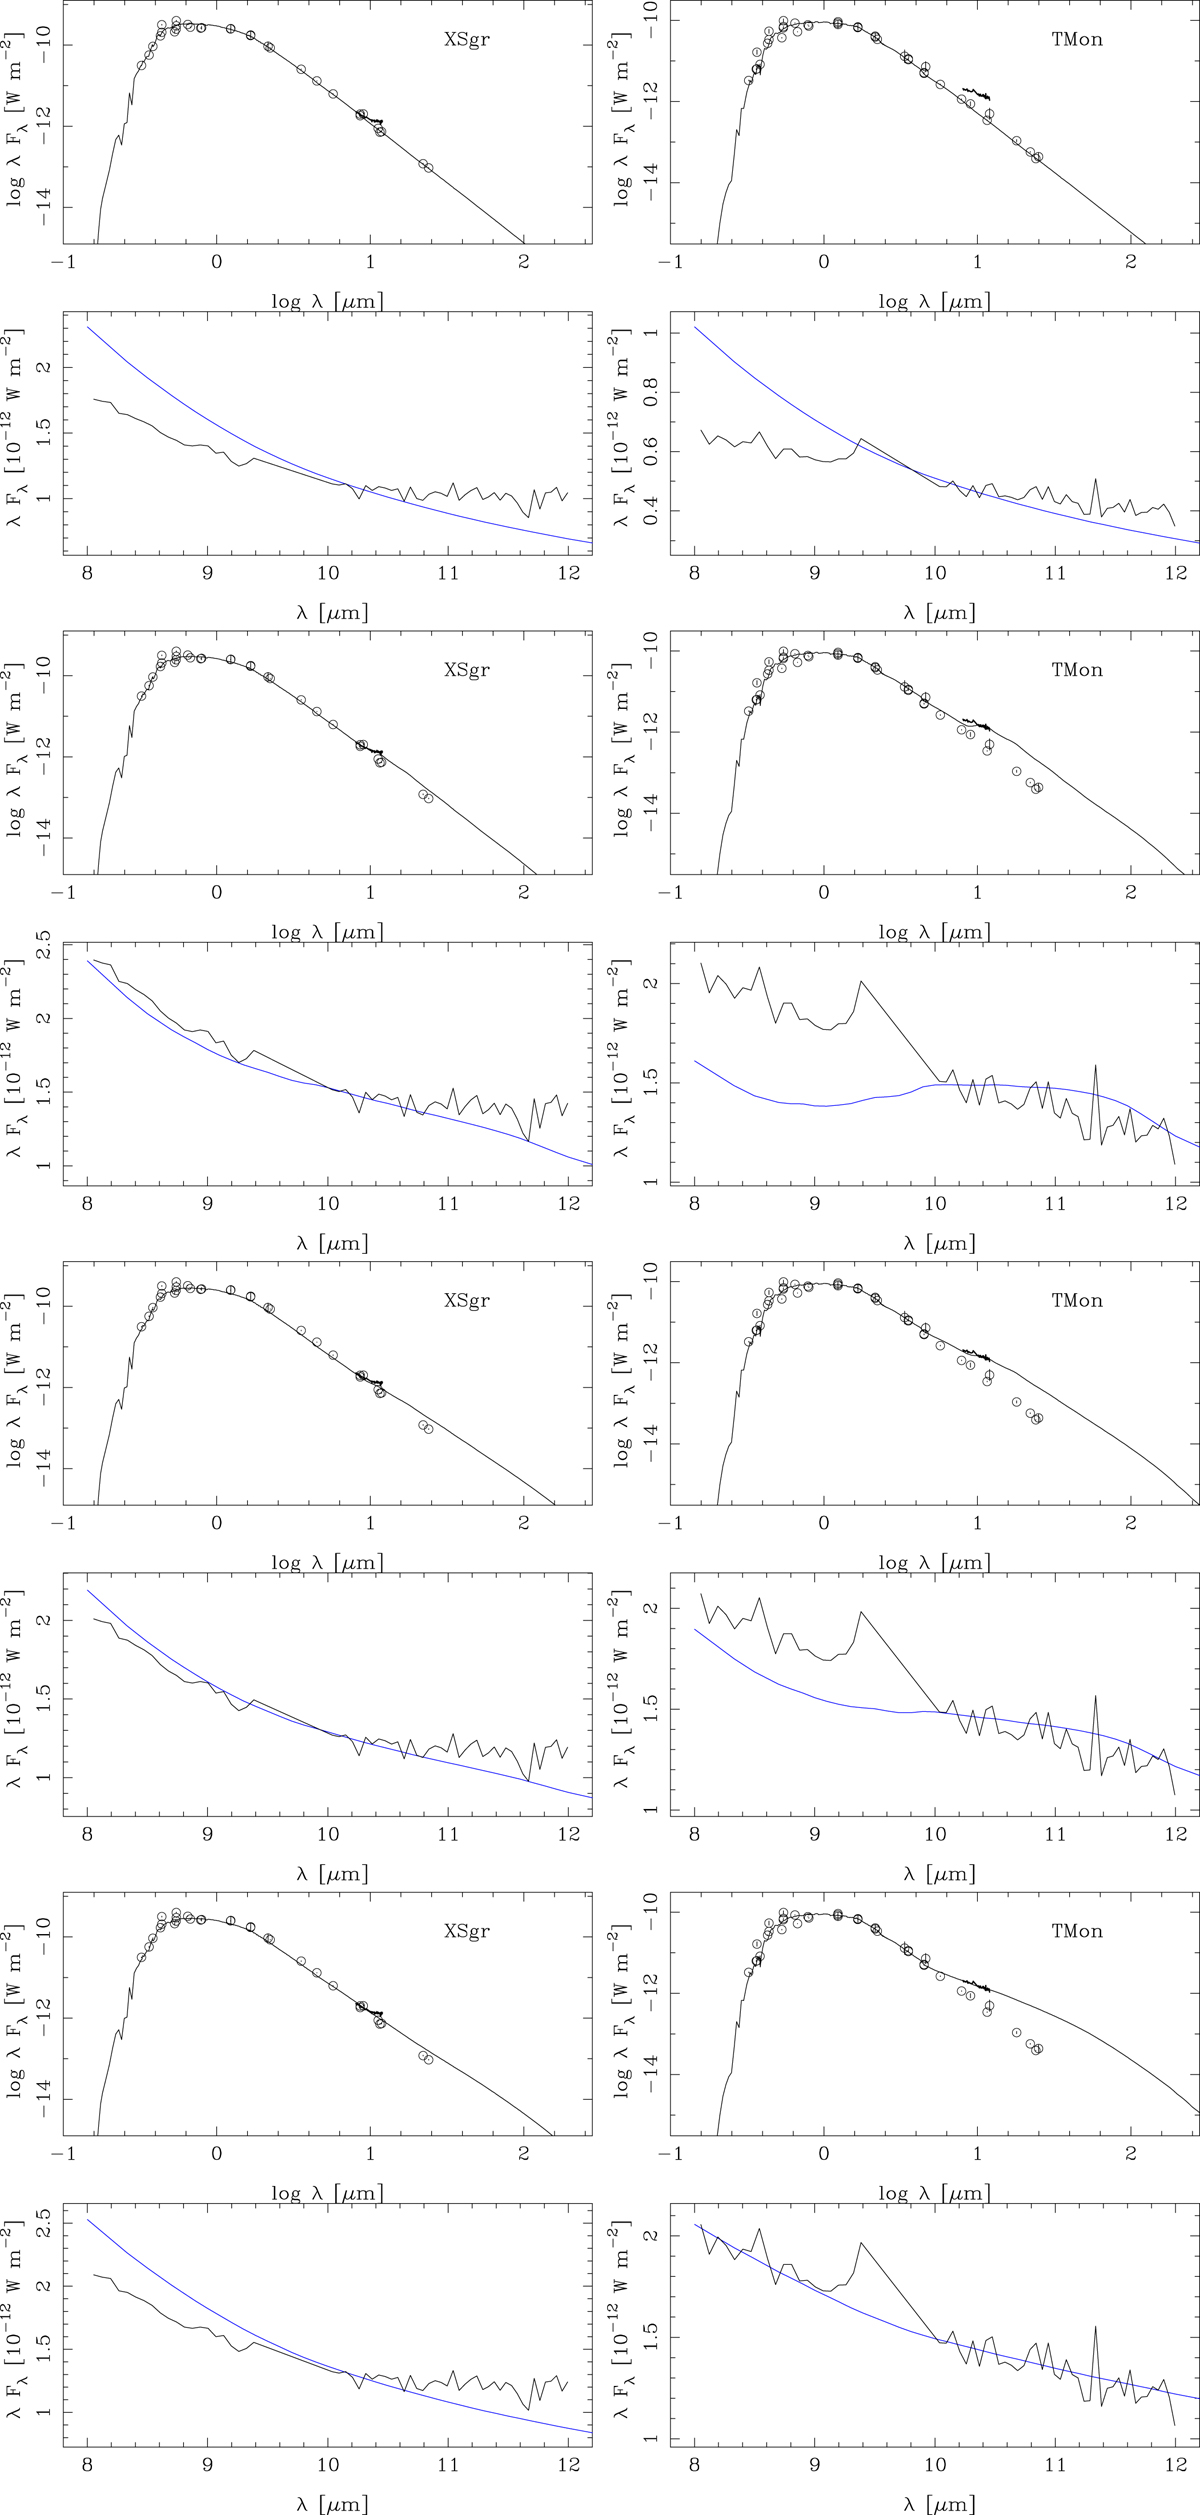
Fits to the SED and mid-IR spectra of T Mon and X Sgr for different dust compositions. Top panel: standard model without dust component. Other three panels: models with dust composed of 80, 94, and 100% iron, respectively, with the remainder evenly split between silicates and aluminium oxide. The mid-IR spectrum is scaled to the model based on the average flux in the 10–10.5 μm region.
Current usage metrics show cumulative count of Article Views (full-text article views including HTML views, PDF and ePub downloads, according to the available data) and Abstracts Views on Vision4Press platform.
Data correspond to usage on the plateform after 2015. The current usage metrics is available 48-96 hours after online publication and is updated daily on week days.
Initial download of the metrics may take a while.