Fig. 4.
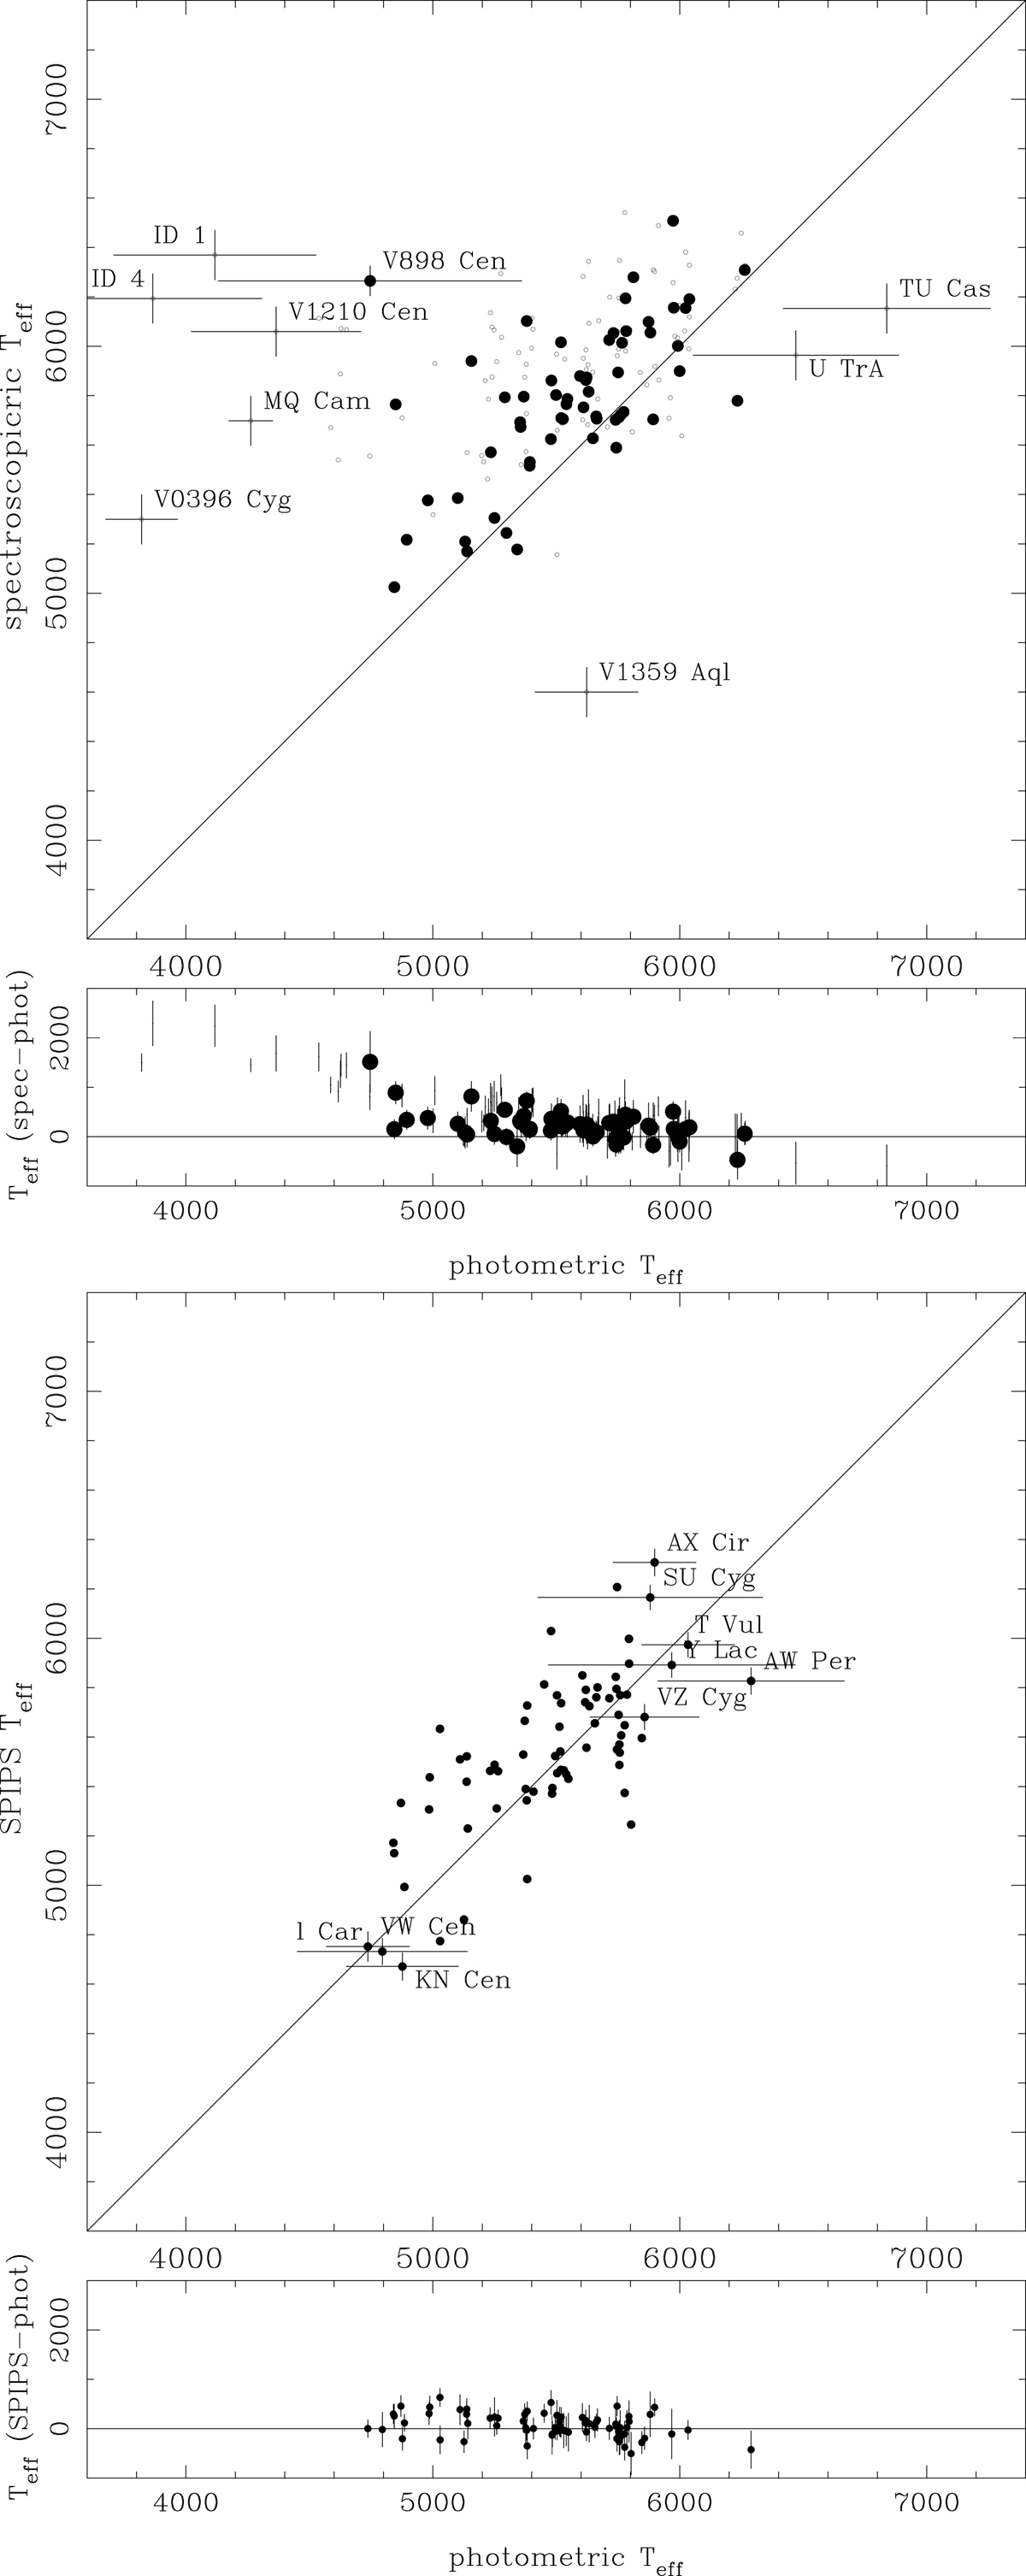
Comparison between the effective temperatures determined from the SED fitting, and in the literature. Stars outside the bulk of objects are identified and plotted with error bars. The one-to-one line is indicated. In the upper figure the temperatures are compared to the data in Luck (2018) (and I19 for ID 1–5). When there are three or more values available in the phase range representative of mean light the object is marked by a thick filled circle. Otherwise when there are two or more observations the average is taken (small open circles). Lower panel: difference between spectroscopic and photometric temperature. In the lower figure the effective temperatures from Trahin (2019) are compared to the present work.
Current usage metrics show cumulative count of Article Views (full-text article views including HTML views, PDF and ePub downloads, according to the available data) and Abstracts Views on Vision4Press platform.
Data correspond to usage on the plateform after 2015. The current usage metrics is available 48-96 hours after online publication and is updated daily on week days.
Initial download of the metrics may take a while.