Fig. 3.
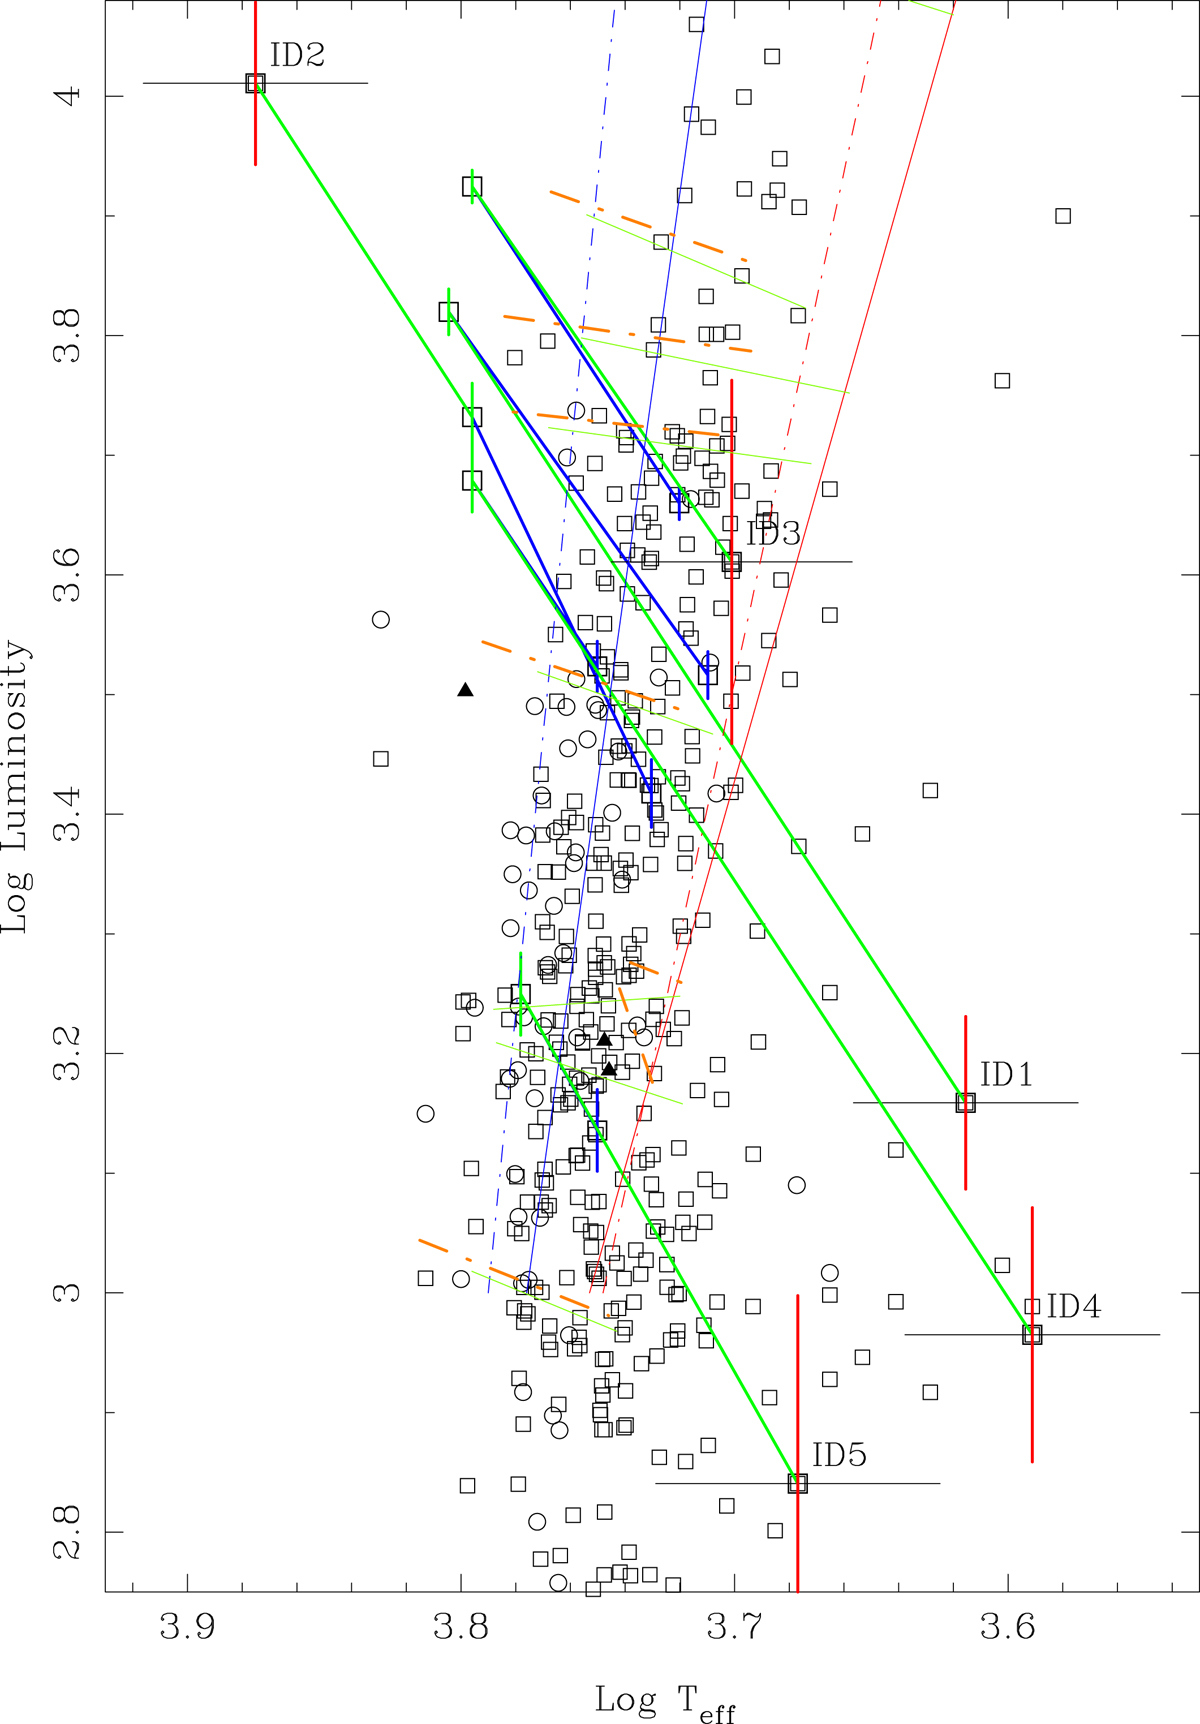
Hertzsprung-Russell diagram, zoomed in on the region covered by the five object in the direction of the Galactic disk. The labelled points with the red vertical error bars indicate the standard case (Fig. 2). They are connected by green lines to the points with the green vertical error bars indicating the cases where the effective temperature is fixed to the value determined from spectroscopy, which in turn are connected by blue lines to the points with blue vertical error bars indicating the cases where the effective temperature is fixed to a value roughly in the middle of the IS.
Current usage metrics show cumulative count of Article Views (full-text article views including HTML views, PDF and ePub downloads, according to the available data) and Abstracts Views on Vision4Press platform.
Data correspond to usage on the plateform after 2015. The current usage metrics is available 48-96 hours after online publication and is updated daily on week days.
Initial download of the metrics may take a while.