Fig. 2.
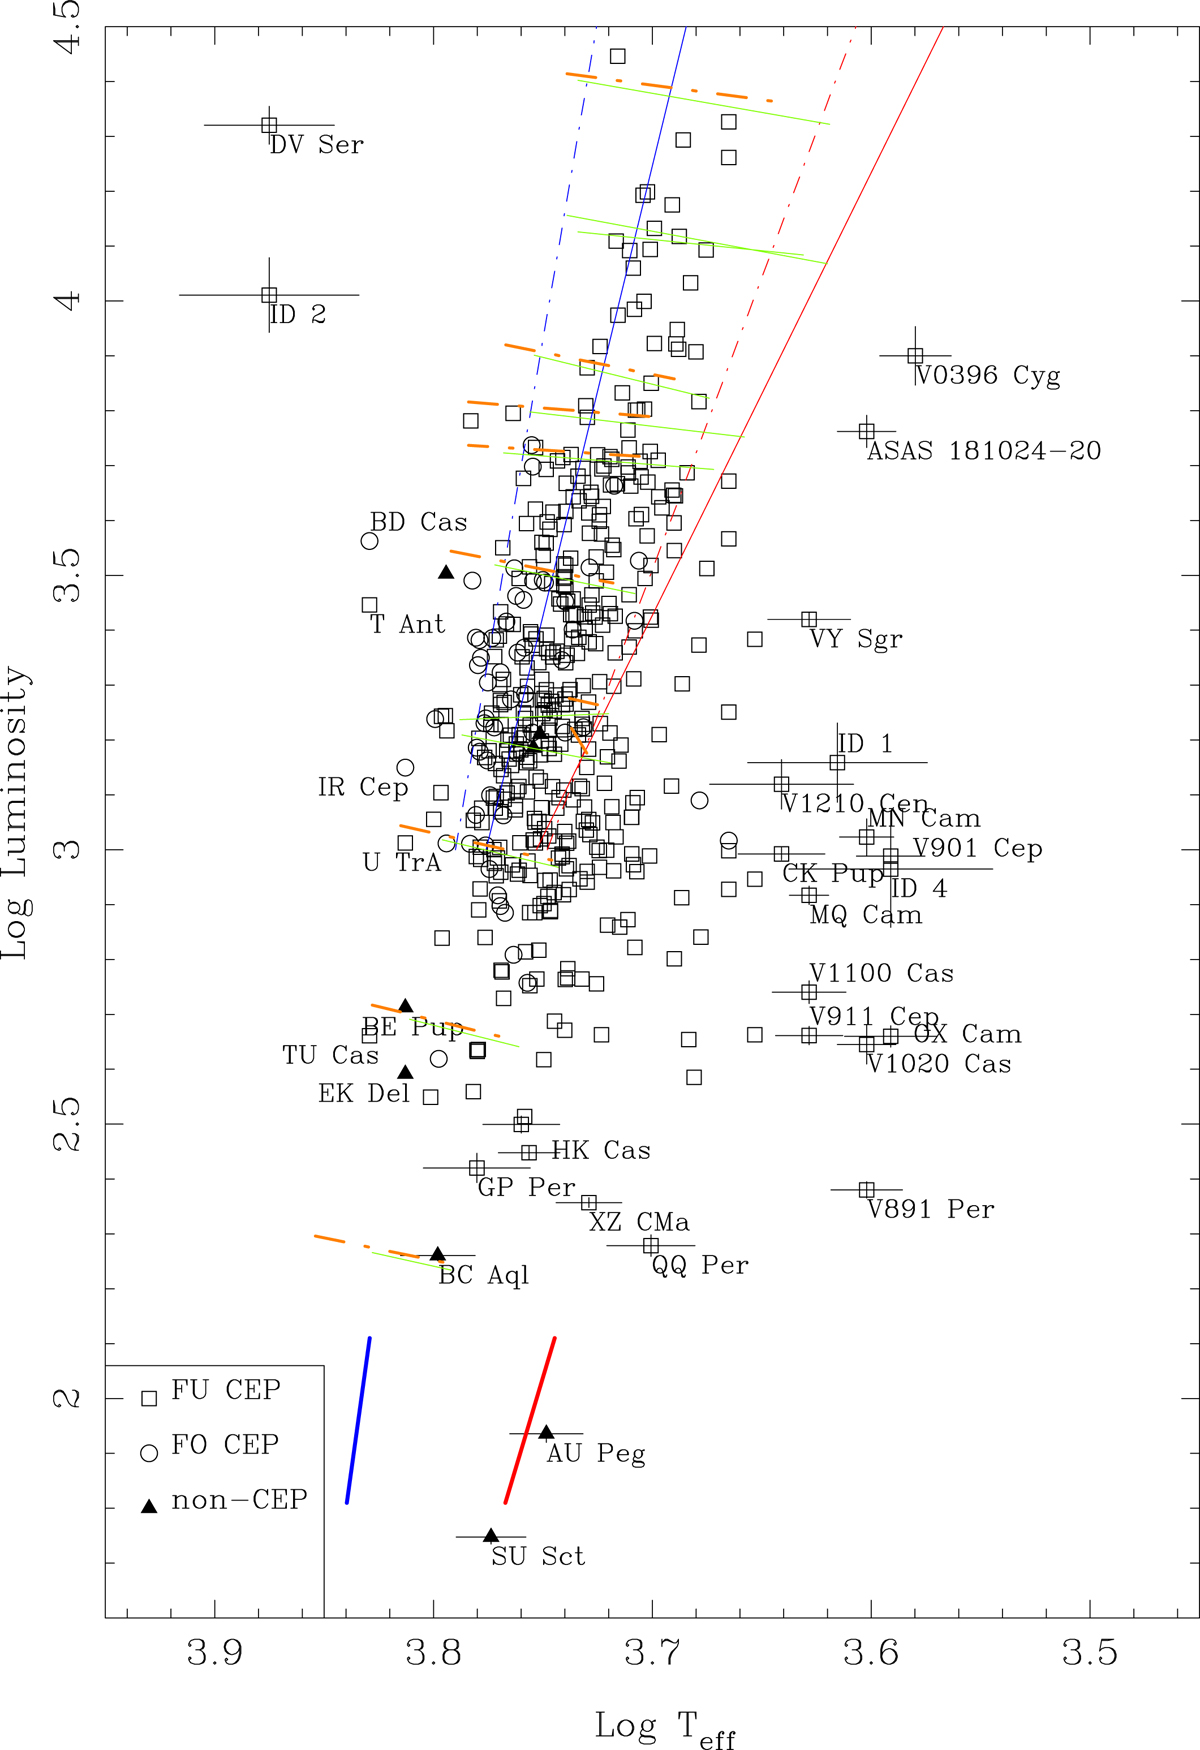
Hertzsprung-Russell diagram. Stars located outside the bulk of objects have been labelled and are plotted with error bars. Blue and red lines indicate the blue and red edge of the IS. At log L ∼ 2 this is the IS for BLHER T2C; at brighter luminosities those for CCs. The near horizontal lines are stellar evolution tracks of CCs of different masses. See the main text for details.
Current usage metrics show cumulative count of Article Views (full-text article views including HTML views, PDF and ePub downloads, according to the available data) and Abstracts Views on Vision4Press platform.
Data correspond to usage on the plateform after 2015. The current usage metrics is available 48-96 hours after online publication and is updated daily on week days.
Initial download of the metrics may take a while.