Fig. A.1.
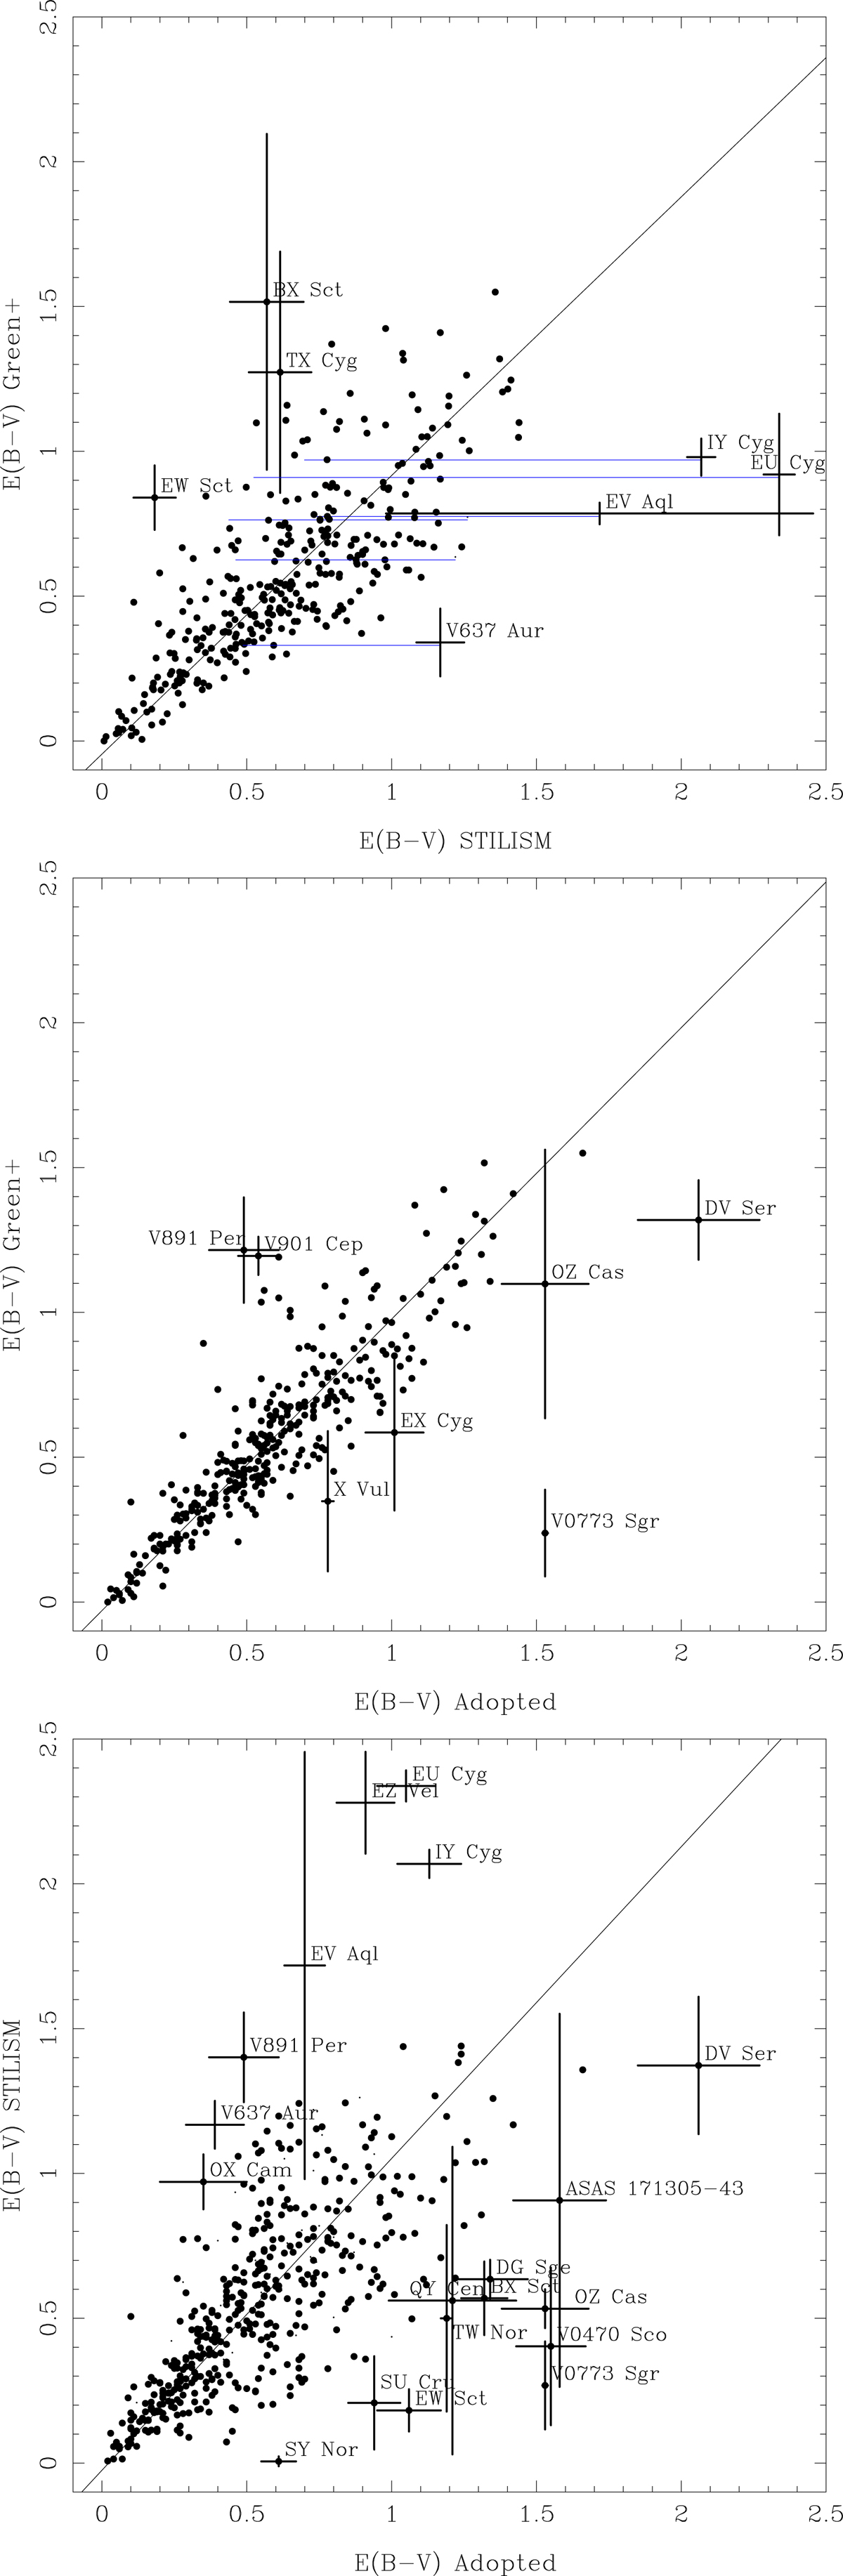
Different E(B − V) values plotted against each other. Outliers are marked and plotted with error bars. Top panel: some of the stars are connected by a blue line. The left point indicates the reddening at the maximum distance available in the STLISM grid in that particular direction. The right point indicates the reddening estimated at the distance of the Cepheid by a linear extrapolation (see Sect. 4.7 for details). The solid lines indicate the least-squares fir from Table A.2.
Current usage metrics show cumulative count of Article Views (full-text article views including HTML views, PDF and ePub downloads, according to the available data) and Abstracts Views on Vision4Press platform.
Data correspond to usage on the plateform after 2015. The current usage metrics is available 48-96 hours after online publication and is updated daily on week days.
Initial download of the metrics may take a while.