Fig. 10.
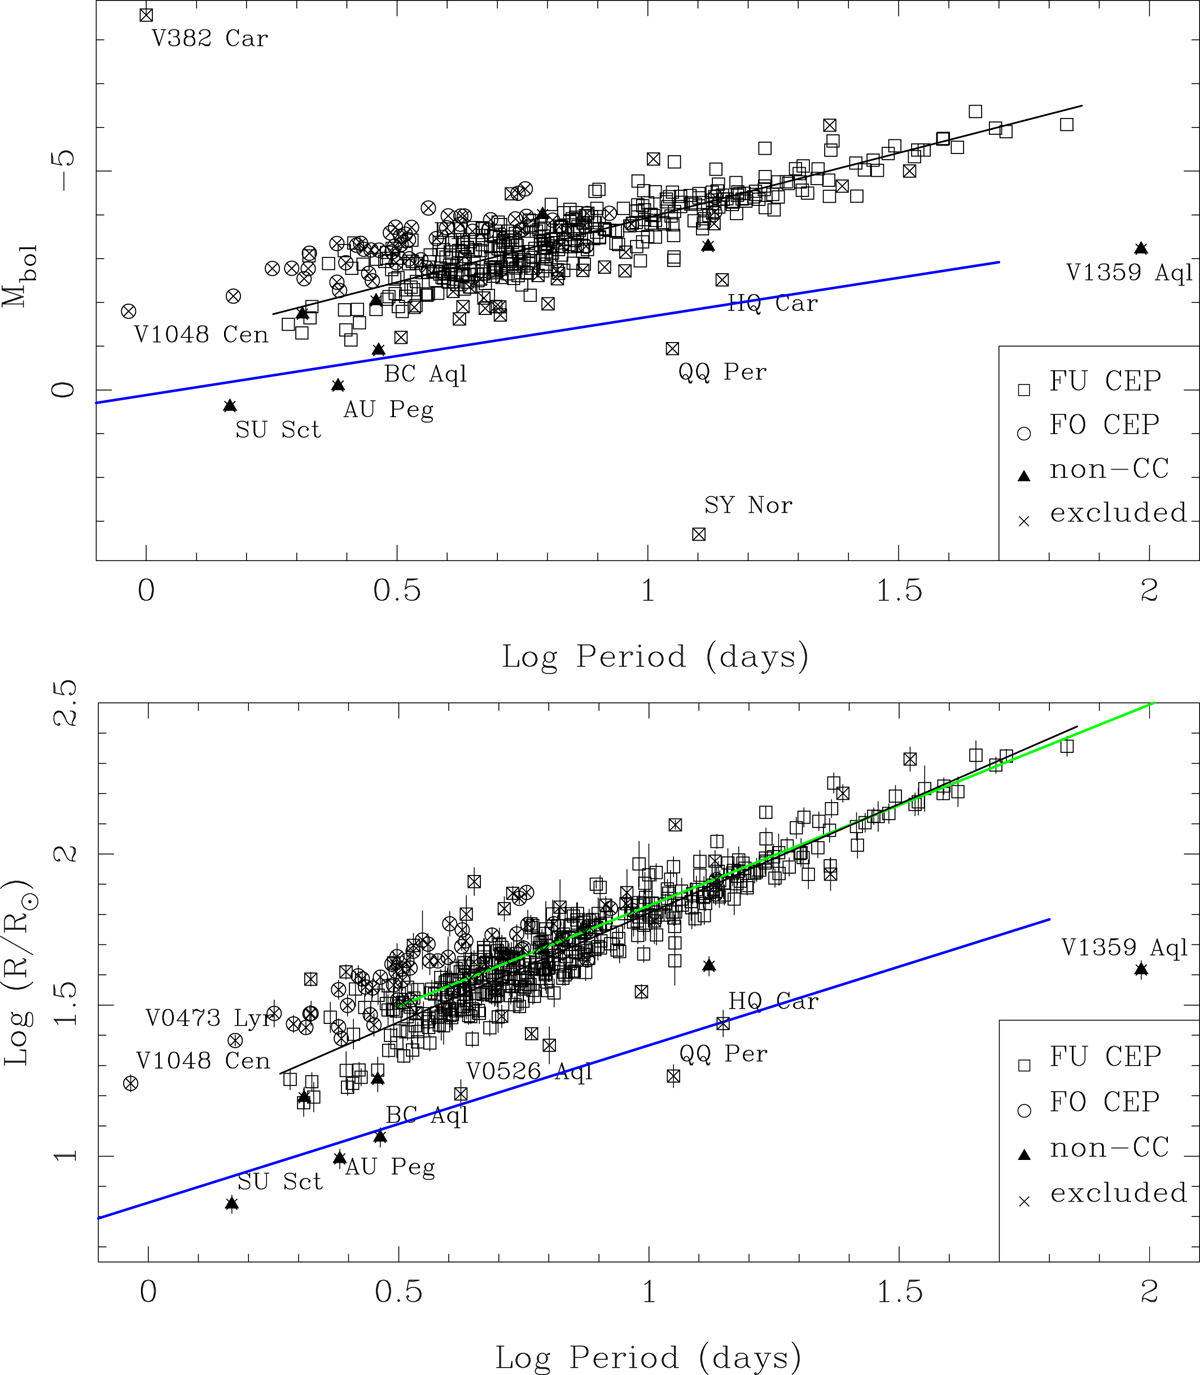
Top panel: period-Mbol relation. Error bars in Mbol are not show as they are smaller than the symbol size. Some outlying stars are identified. The black line indicates the best fit to the fundamental mode Cepheids (excluding outliers). The blue line gives the PL relation for T2Cs in the MCs from Groenewegen & Jurkovic (2017b). Bottom panel: period-radius relation. Some outlying stars are identified. The black line indicates the best fit to the fundamental mode Cepheids (excluding outliers). The blue line gives the PR relation for T2Cs in the MCs from Groenewegen & Jurkovic (2017b). The green line is the theoretical PR relation from Anderson et al. (2016).
Current usage metrics show cumulative count of Article Views (full-text article views including HTML views, PDF and ePub downloads, according to the available data) and Abstracts Views on Vision4Press platform.
Data correspond to usage on the plateform after 2015. The current usage metrics is available 48-96 hours after online publication and is updated daily on week days.
Initial download of the metrics may take a while.