Fig. B.1
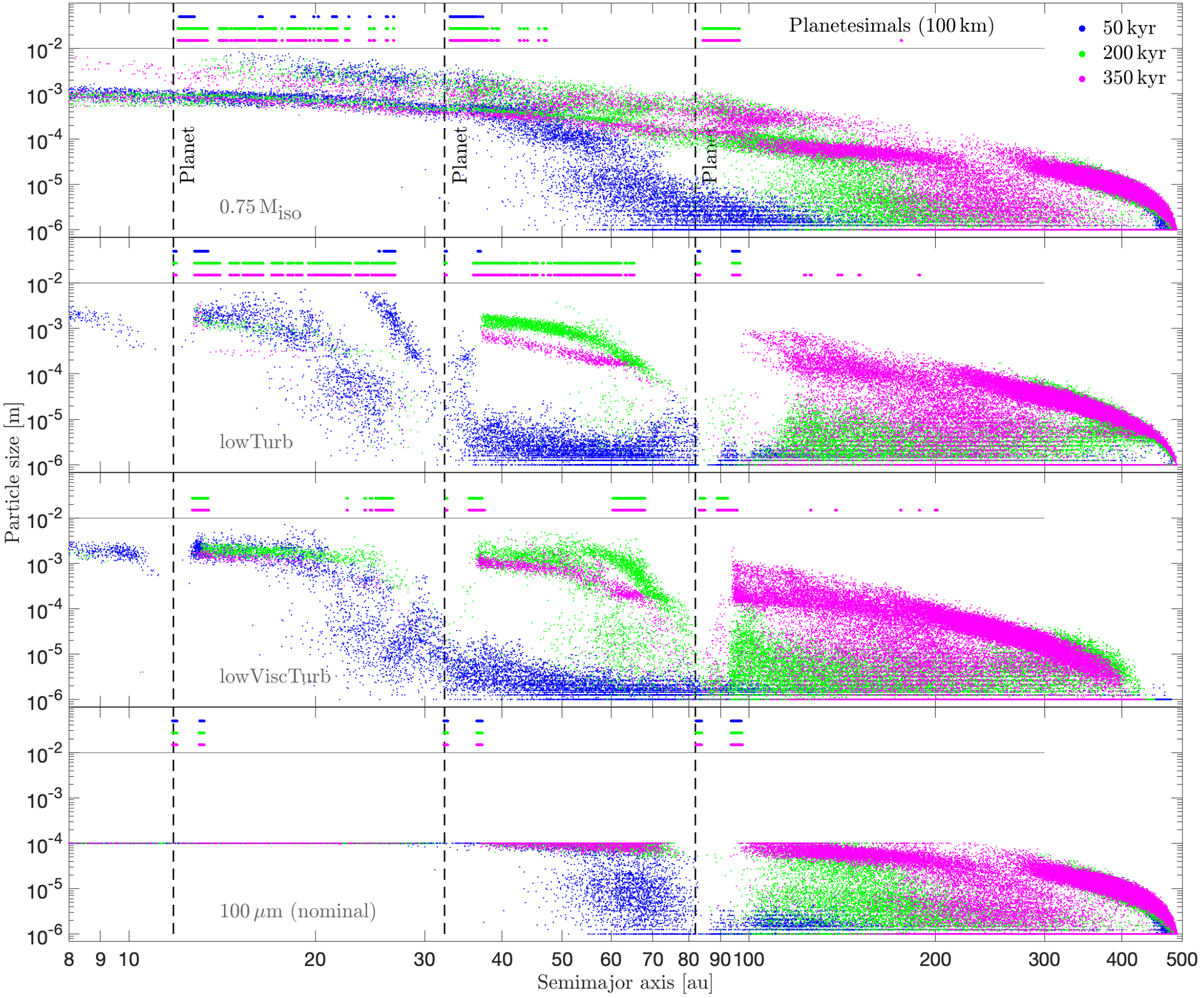
Particle size distributions at different times during disc evolution for four different simulations. The semimajor axes of the formed planetesimals are indicated at the top of the plots. Top panel: in the simulation with a planetary mass of 0.75 Miso, planetesimals form in a wider region around the pressure bump than in the nominal simulation. Less efficient pebble trapping at the pressure bump also results in a more even distribution of dust and pebbles in the disc, with no strong depletion at the location of the planets. Second panel: lowering the turbulence diffusion to 10−4 results in slower collisional velocities, which results in slower coagulation, but eventually leads to larger particle sizes. Third panel: when the viscous parameter is lowered to 10−4 as well, we get small bumps in the gas surface density profile at the inner edges of the planetary gaps. Particles become trapped in these bumps, which also result in some planetesimal formation at these locations. Bottom panel: this plot shows the implementation of a maximum grain size of 100 μm.
Current usage metrics show cumulative count of Article Views (full-text article views including HTML views, PDF and ePub downloads, according to the available data) and Abstracts Views on Vision4Press platform.
Data correspond to usage on the plateform after 2015. The current usage metrics is available 48-96 hours after online publication and is updated daily on week days.
Initial download of the metrics may take a while.