Fig. A.1.
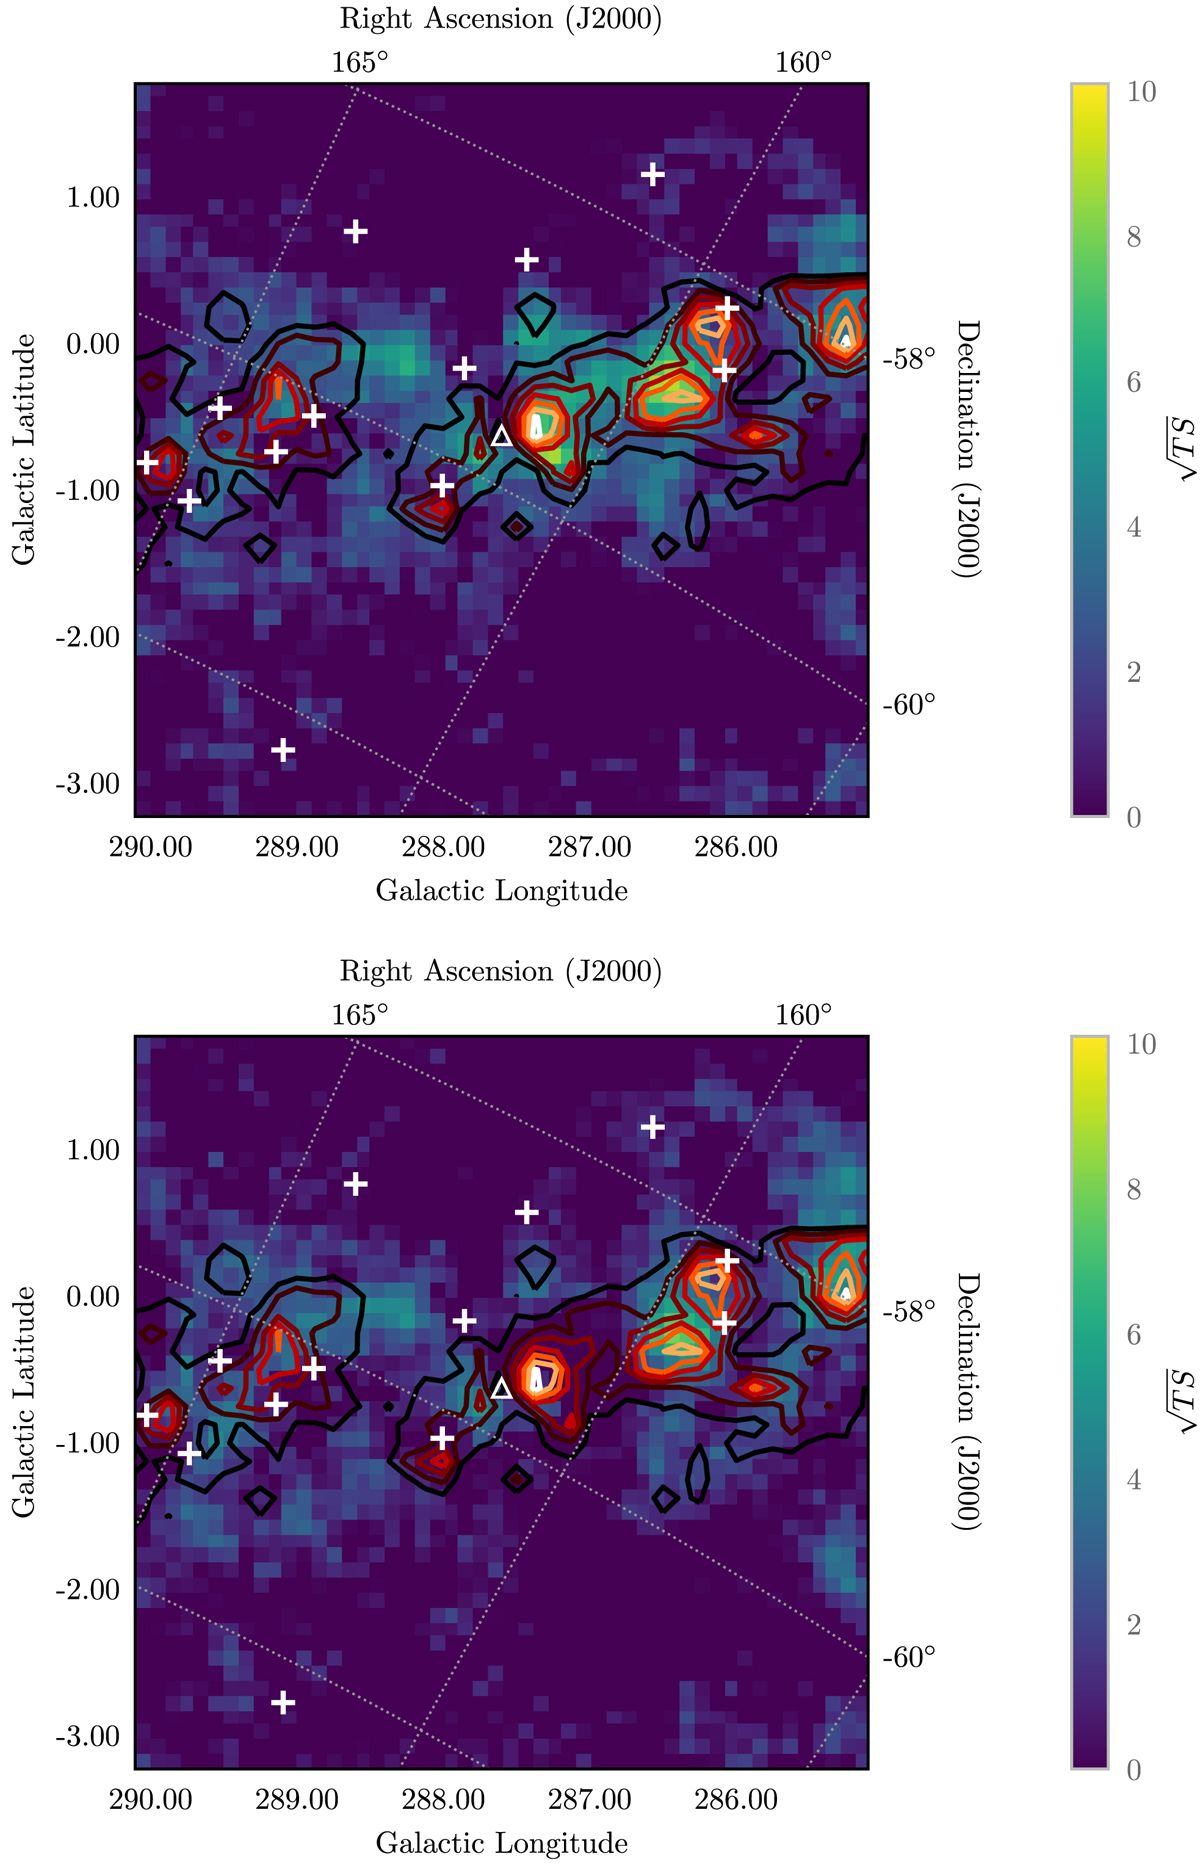
Residual TS maps, with default 4FGL catalogue sources included (upper) and with the CO template is included in the model (lower). The position of η Car is denoted by a hollow white triangle. The two closest 4FGL catalogue sources are indicated by white crosses. Overlaid are contours from a template generated from the CO measurements in Dame et al. (2001).
Current usage metrics show cumulative count of Article Views (full-text article views including HTML views, PDF and ePub downloads, according to the available data) and Abstracts Views on Vision4Press platform.
Data correspond to usage on the plateform after 2015. The current usage metrics is available 48-96 hours after online publication and is updated daily on week days.
Initial download of the metrics may take a while.