Fig. 2.
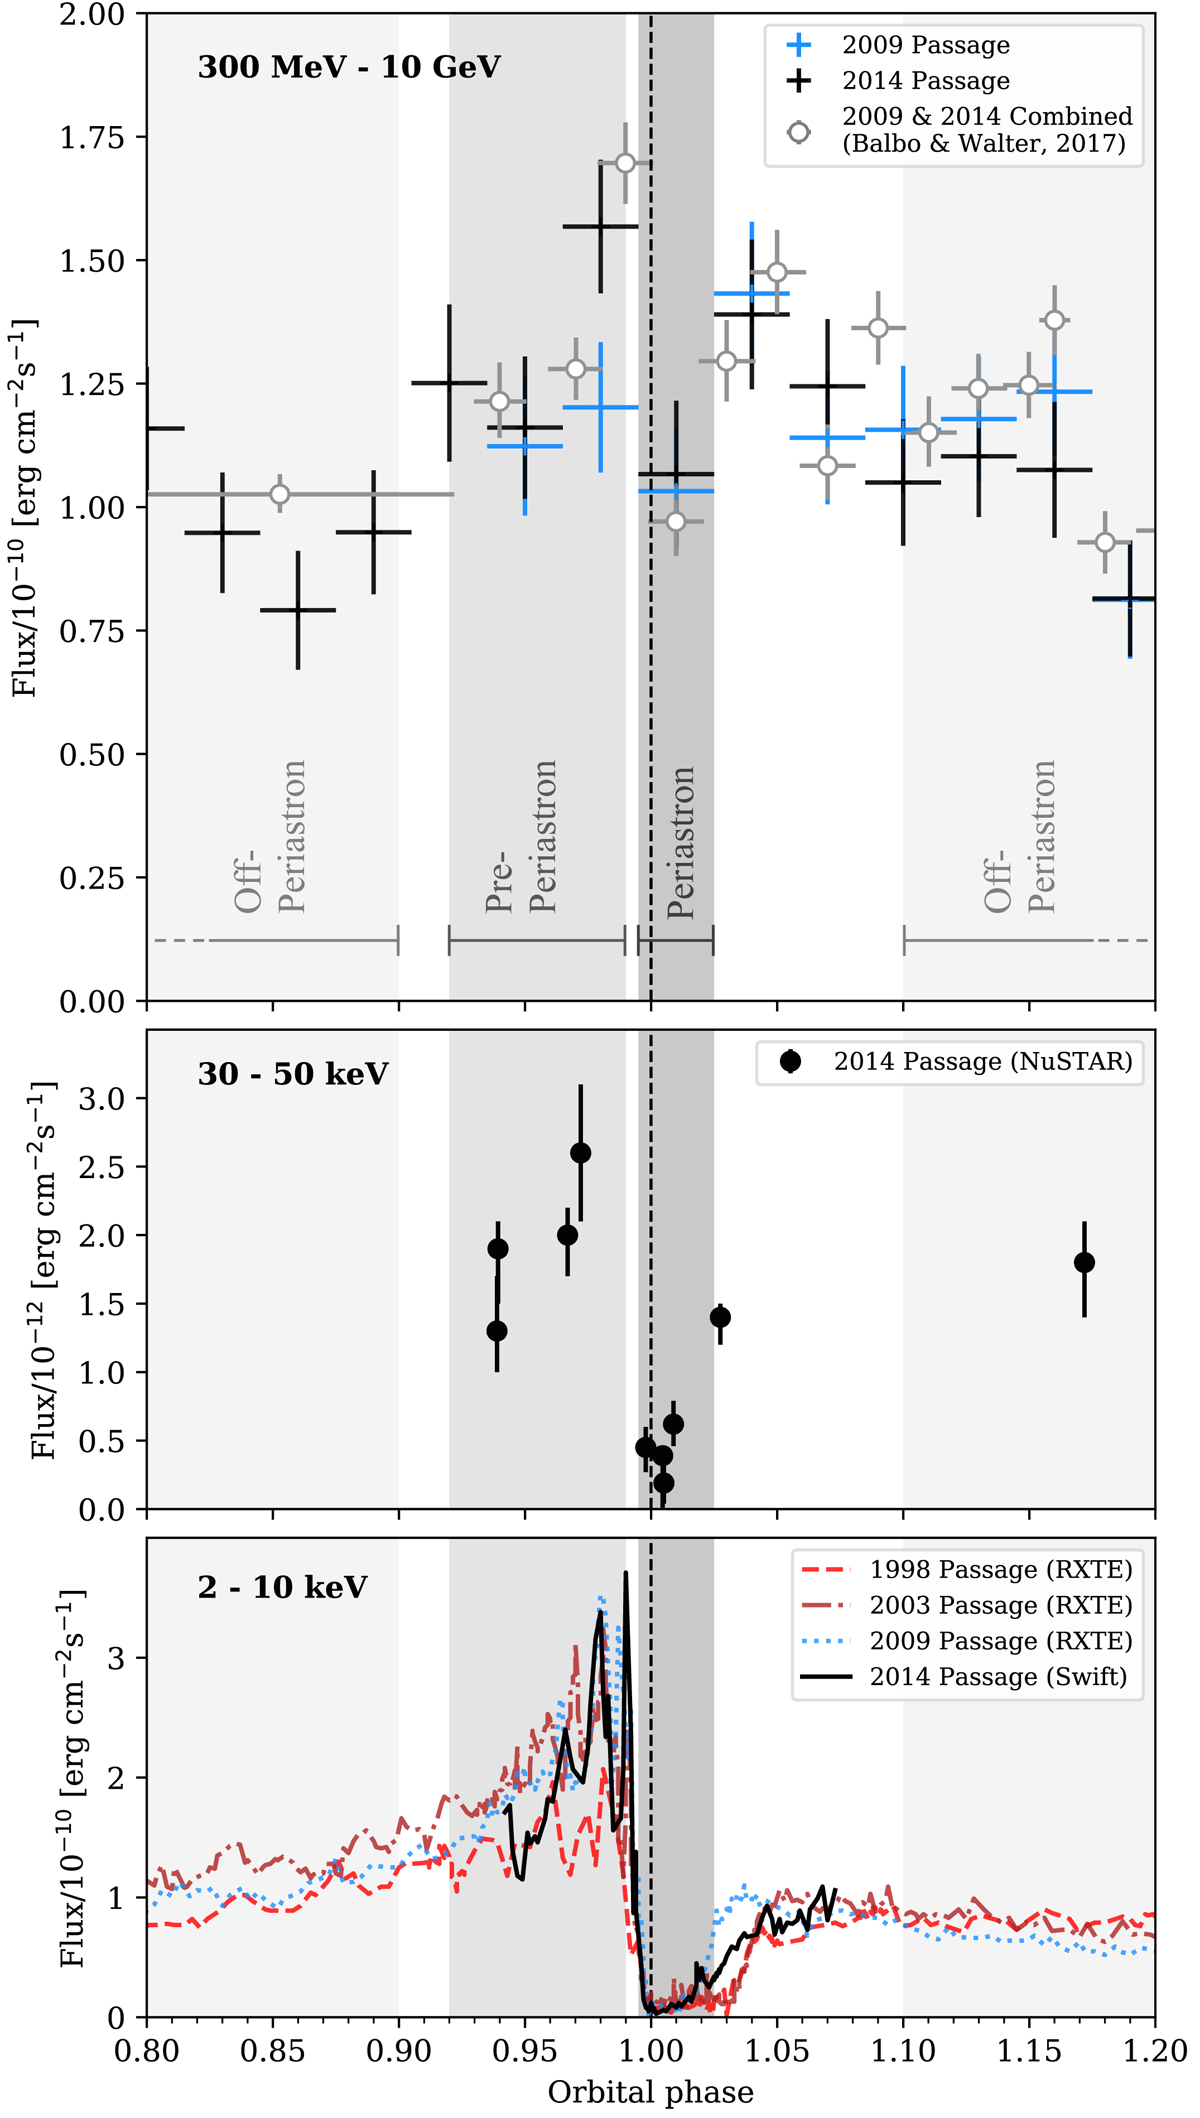
Upper panel: Fermi-LAT temporal analysis of η Car from 300 MeV to 10 GeV from orbital phase 0.8 to 1.2 in 0.03 phase bins. Data corresponding to the first orbital period observed by the Fermi-LAT (with periastron in 2009) are shown in blue, and those corresponding to the second orbital period (with periastron in 2014) in black. Vertical grey shaded areas indicate the phase ranges used in the spectral analysis presented in Sect. 2.4 around periastron, pre-periastron, and off-periastron. The points from Balbo & Walter (2017) are shown as hollow grey circles. The vertical black dashed line indicates periastron. Middle panel: NuSTAR points for the 2014 periastron passage from Hamaguchi et al. (2018). Lower panel: RXTE and Swift data for the last four periastron passages.
Current usage metrics show cumulative count of Article Views (full-text article views including HTML views, PDF and ePub downloads, according to the available data) and Abstracts Views on Vision4Press platform.
Data correspond to usage on the plateform after 2015. The current usage metrics is available 48-96 hours after online publication and is updated daily on week days.
Initial download of the metrics may take a while.