Fig. 1.
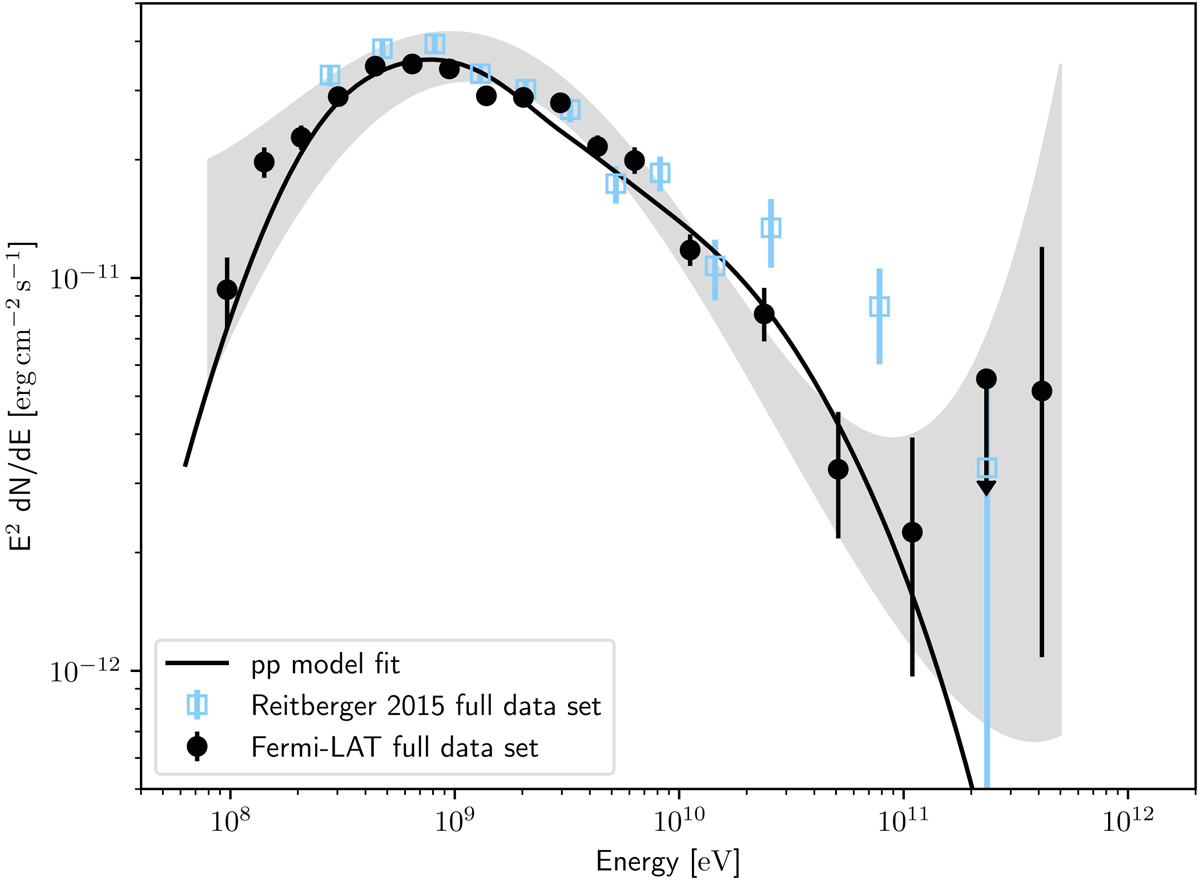
Spectral energy distribution resulting from Fermi-LAT analysis of η Car over the full data set (black points) together with a systematic error band (grey area). A fit to the data points below 200 GeV using the Naima package (Zabalza 2015) is shown by the black curve under the assumption that the γ-ray emission arises from proton-proton interactions with an exponential cutoff power-law distribution for the protons. Data points from a previous Fermi-LAT analysis (Reitberger et al. 2015) are shown in blue for comparison.
Current usage metrics show cumulative count of Article Views (full-text article views including HTML views, PDF and ePub downloads, according to the available data) and Abstracts Views on Vision4Press platform.
Data correspond to usage on the plateform after 2015. The current usage metrics is available 48-96 hours after online publication and is updated daily on week days.
Initial download of the metrics may take a while.