Fig. 5
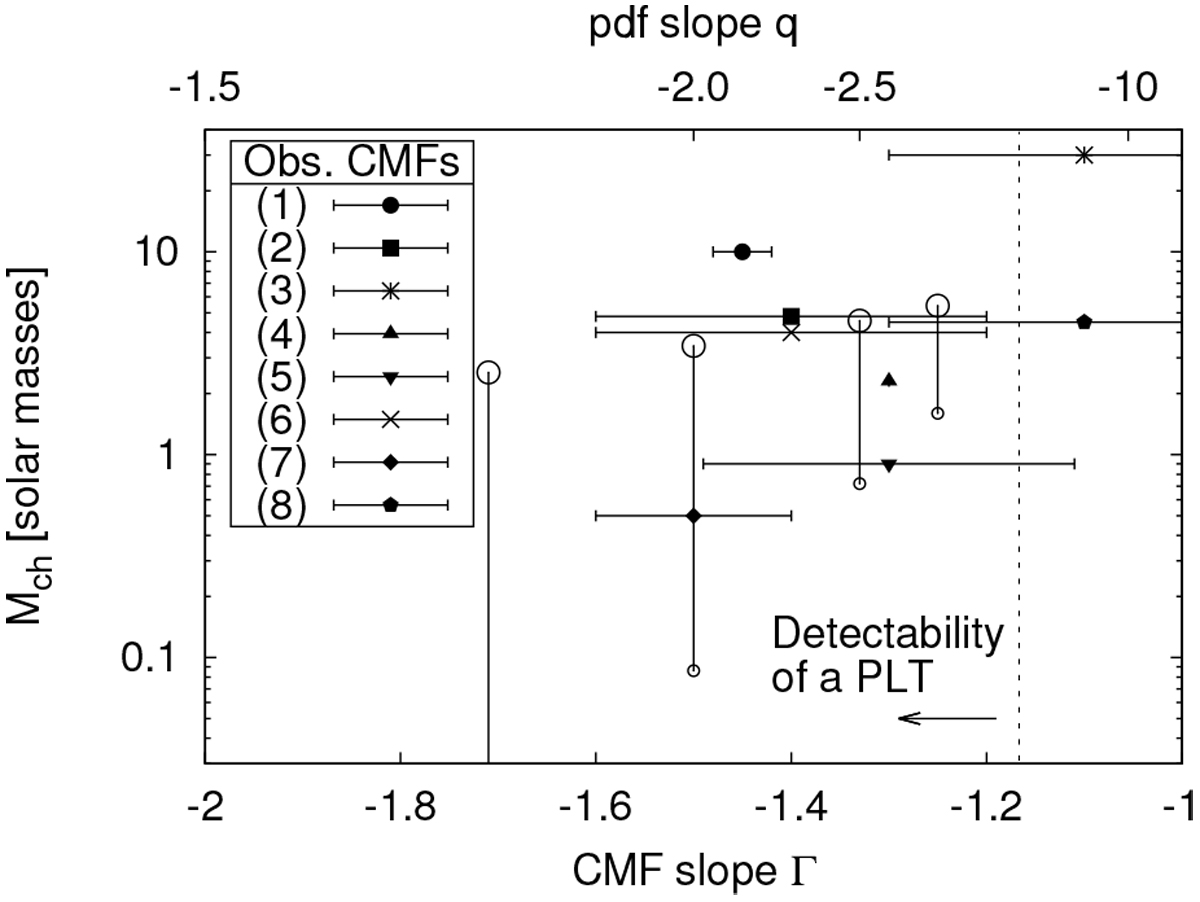
Parameters of modeled mass functions of unstable cores (open symbols) compared with those of the high-mass part of observational CMFs (filled symbols; the numbers correspond to the data in Table 2). Vertical solid lines denote the range of characteristic masses generated by varying (Mc ∕MJ, c)∕Nc from 0.5 (large symbols) to 20.0 (small symbols). The domain of PLTs which can be distinguished from a lognormal wing (q ≳ −4) is shown with a vertical dashed line and an arrow. See text.
Current usage metrics show cumulative count of Article Views (full-text article views including HTML views, PDF and ePub downloads, according to the available data) and Abstracts Views on Vision4Press platform.
Data correspond to usage on the plateform after 2015. The current usage metrics is available 48-96 hours after online publication and is updated daily on week days.
Initial download of the metrics may take a while.