Free Access
Fig. 2
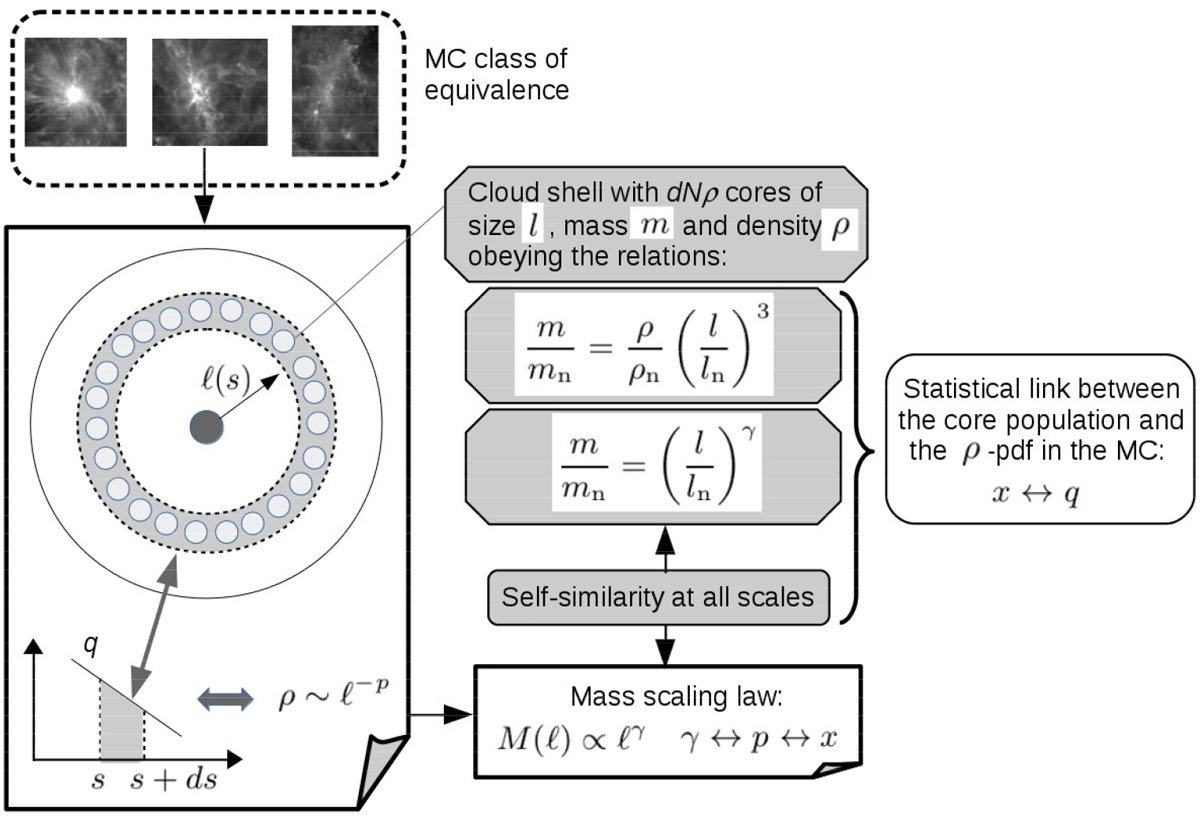
Sketch of the model setting which shows the statistical link between the density distribution in the cloud and the core population. The double-ended arrows denote one-to-one correspondence between quantities. The concepts introduced in this work (in regard to the DVK17 model) are shaded in gray.
Current usage metrics show cumulative count of Article Views (full-text article views including HTML views, PDF and ePub downloads, according to the available data) and Abstracts Views on Vision4Press platform.
Data correspond to usage on the plateform after 2015. The current usage metrics is available 48-96 hours after online publication and is updated daily on week days.
Initial download of the metrics may take a while.