Fig. A.1.
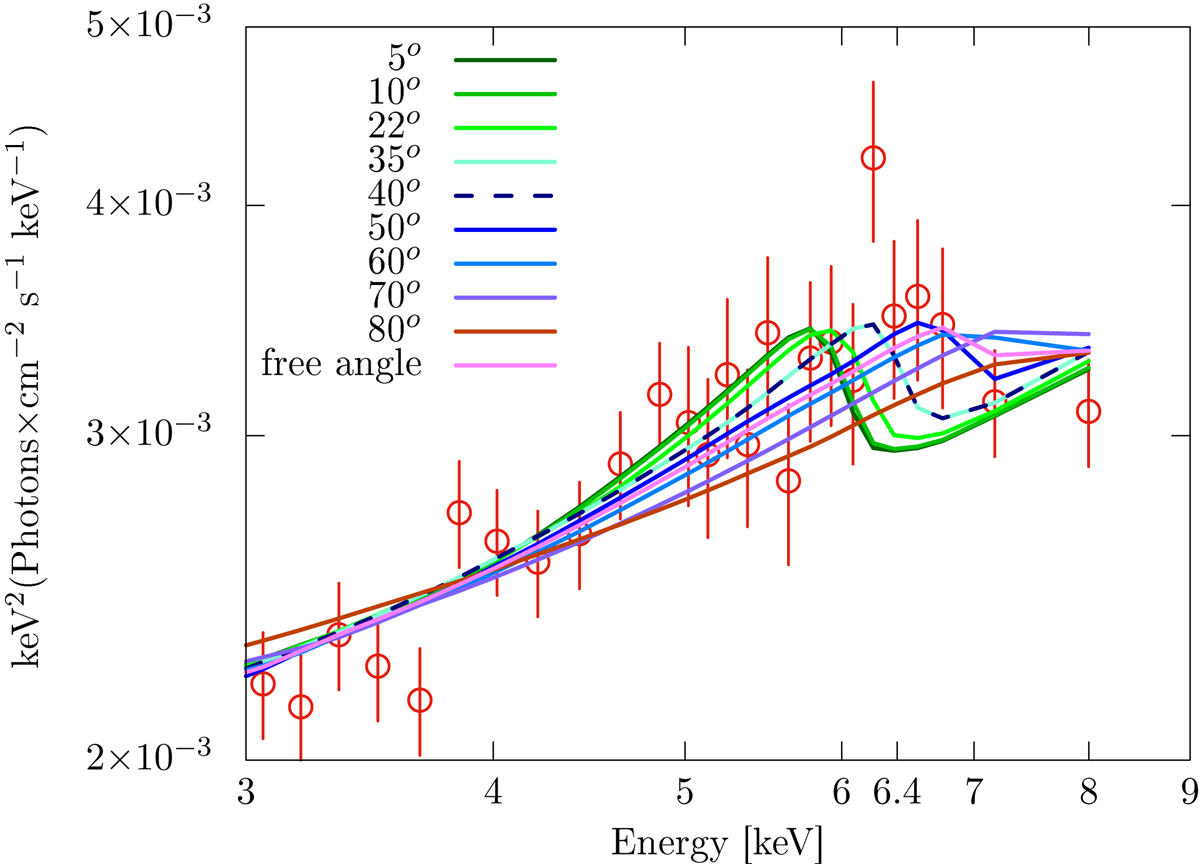
RELXILL fits of the high-energy edge of the iron line of the combined 2000 and 2017 data sets for the different inclination angles shown in Table A.1. The figure shows the 3−9 keV part of the spectrum. At lower angles, the model fits of the iron line are skewed toward the left side whereas at higher angles the fits display a linear tendency with a change in the slope. The models around the line resemble a broadened and asymmetric feature when the disk inclination lies, for instance, between 40 and 55°.
Current usage metrics show cumulative count of Article Views (full-text article views including HTML views, PDF and ePub downloads, according to the available data) and Abstracts Views on Vision4Press platform.
Data correspond to usage on the plateform after 2015. The current usage metrics is available 48-96 hours after online publication and is updated daily on week days.
Initial download of the metrics may take a while.