Free Access
Fig. 4.
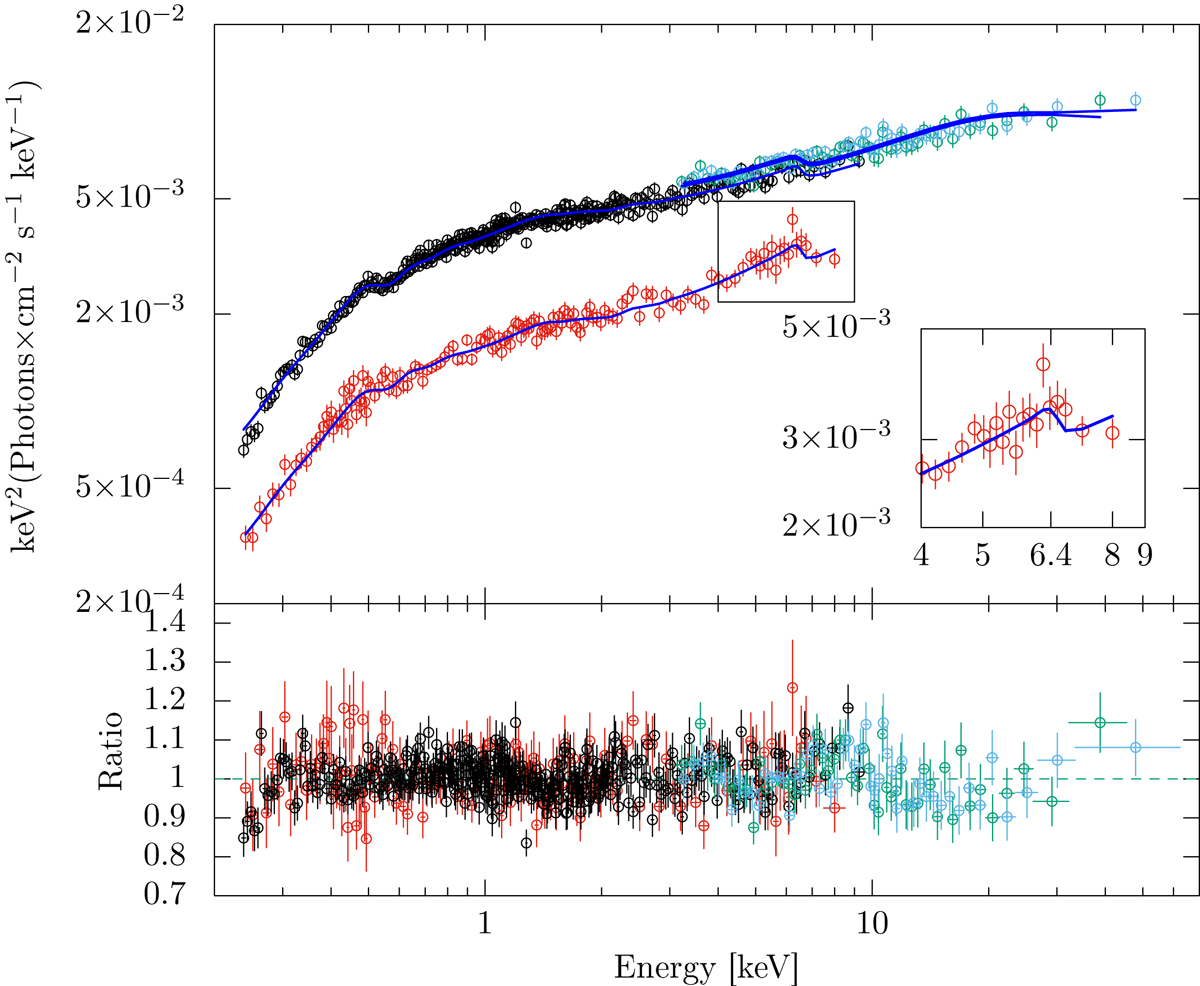
Joint-fit of the combined 2000 and 2017 data sets with the RELXILL model (blue line). The data-to-model ratio is shown in the lower panel. The model fits the iron line as a heavily broadened and asymmetric feature, indicating emission from very close to the black hole event horizon.
Current usage metrics show cumulative count of Article Views (full-text article views including HTML views, PDF and ePub downloads, according to the available data) and Abstracts Views on Vision4Press platform.
Data correspond to usage on the plateform after 2015. The current usage metrics is available 48-96 hours after online publication and is updated daily on week days.
Initial download of the metrics may take a while.