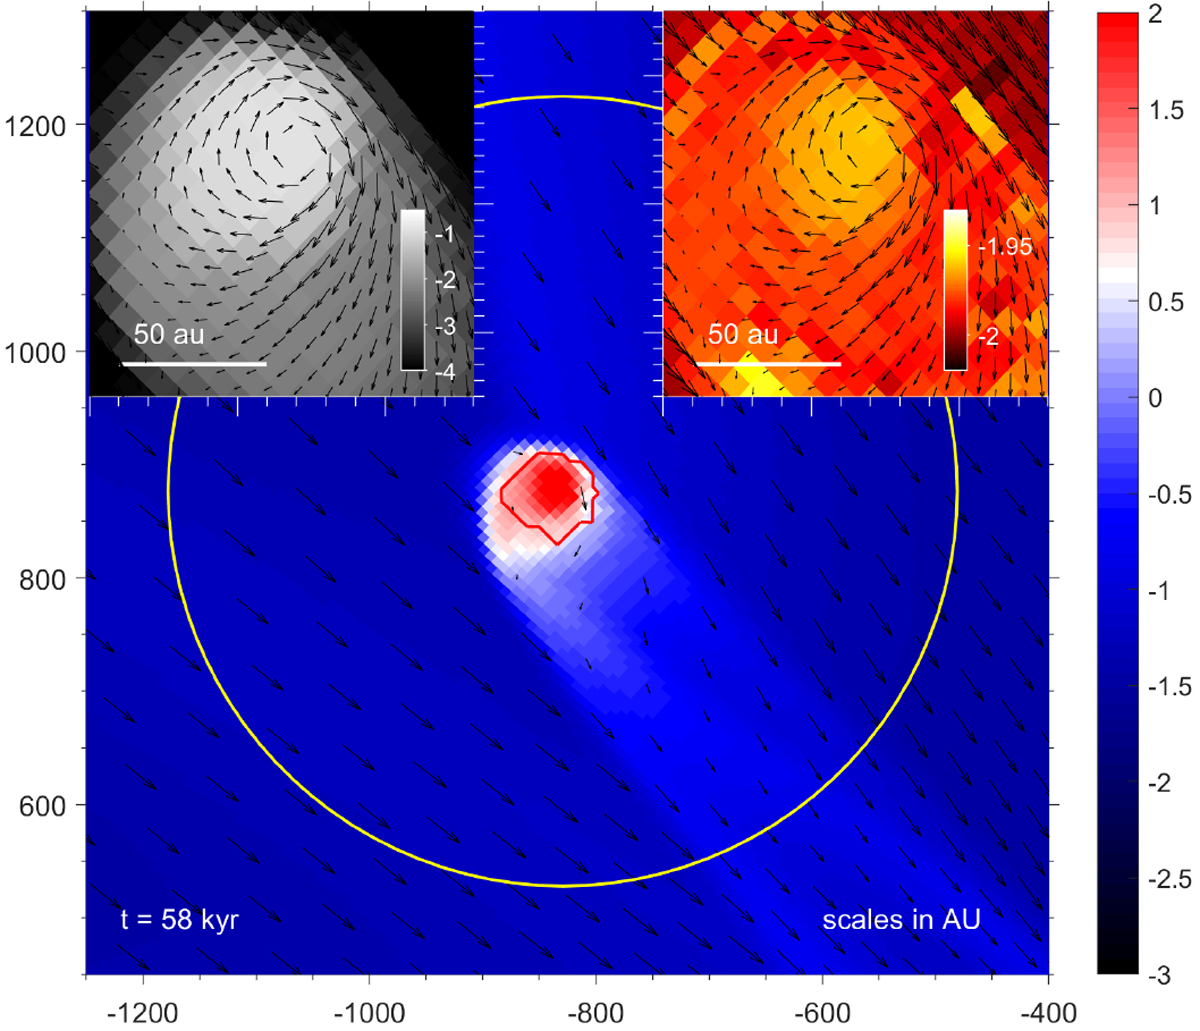
Fig. 3

Gas surface density map in the vicinity of clump F3 at t = 58 kyr. The color bar is in log g cm−2. The yellow line shows the Hill radius of the ejected clump. The red contour line outlines the shape of the clump. The insets in thetop-right and top-left corners show, respectively, the dust-to-gas-mass ratio and the maximum grown dust size (in log cm) around the clump. The black arrows show the gas velocity field in the frame of reference of the clump.
Current usage metrics show cumulative count of Article Views (full-text article views including HTML views, PDF and ePub downloads, according to the available data) and Abstracts Views on Vision4Press platform.
Data correspond to usage on the plateform after 2015. The current usage metrics is available 48-96 hours after online publication and is updated daily on week days.
Initial download of the metrics may take a while.


