Fig. 8
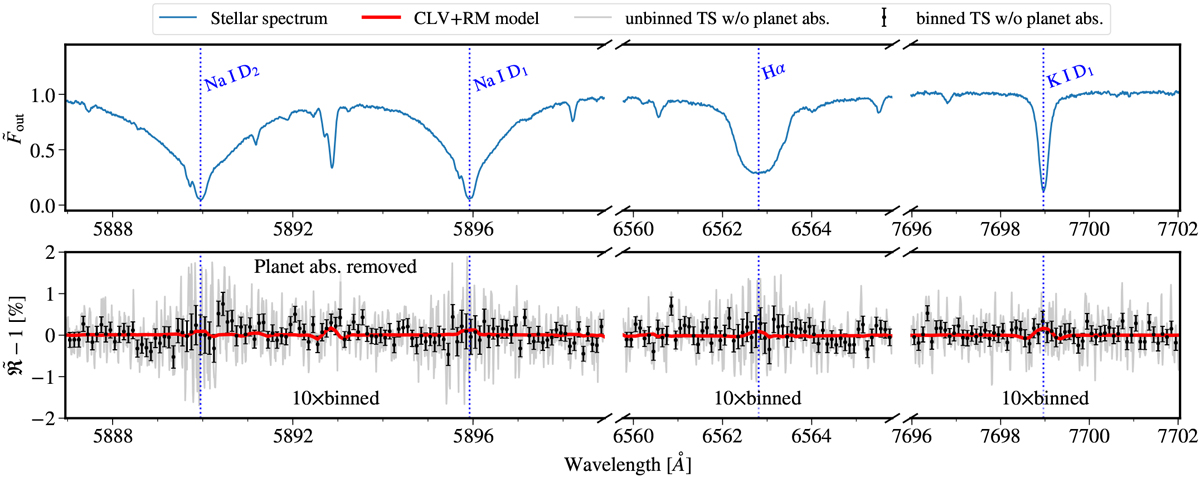
Top panel: master-out stellar spectrum at the Na doublet, Hα, and K D1 lines. Bottom panel: corresponding “transmission spectrum” (TS), where the center-to-limb variation and Rossiter-McLaughlin (CLV+RM) effects have not been corrected and the best-fit planetary absorption signals have been removed. The gray line and black circles refer to the unbinned and binned TS, respectively. The red line shows the CLV+RM model.
Current usage metrics show cumulative count of Article Views (full-text article views including HTML views, PDF and ePub downloads, according to the available data) and Abstracts Views on Vision4Press platform.
Data correspond to usage on the plateform after 2015. The current usage metrics is available 48-96 hours after online publication and is updated daily on week days.
Initial download of the metrics may take a while.