Fig. 6
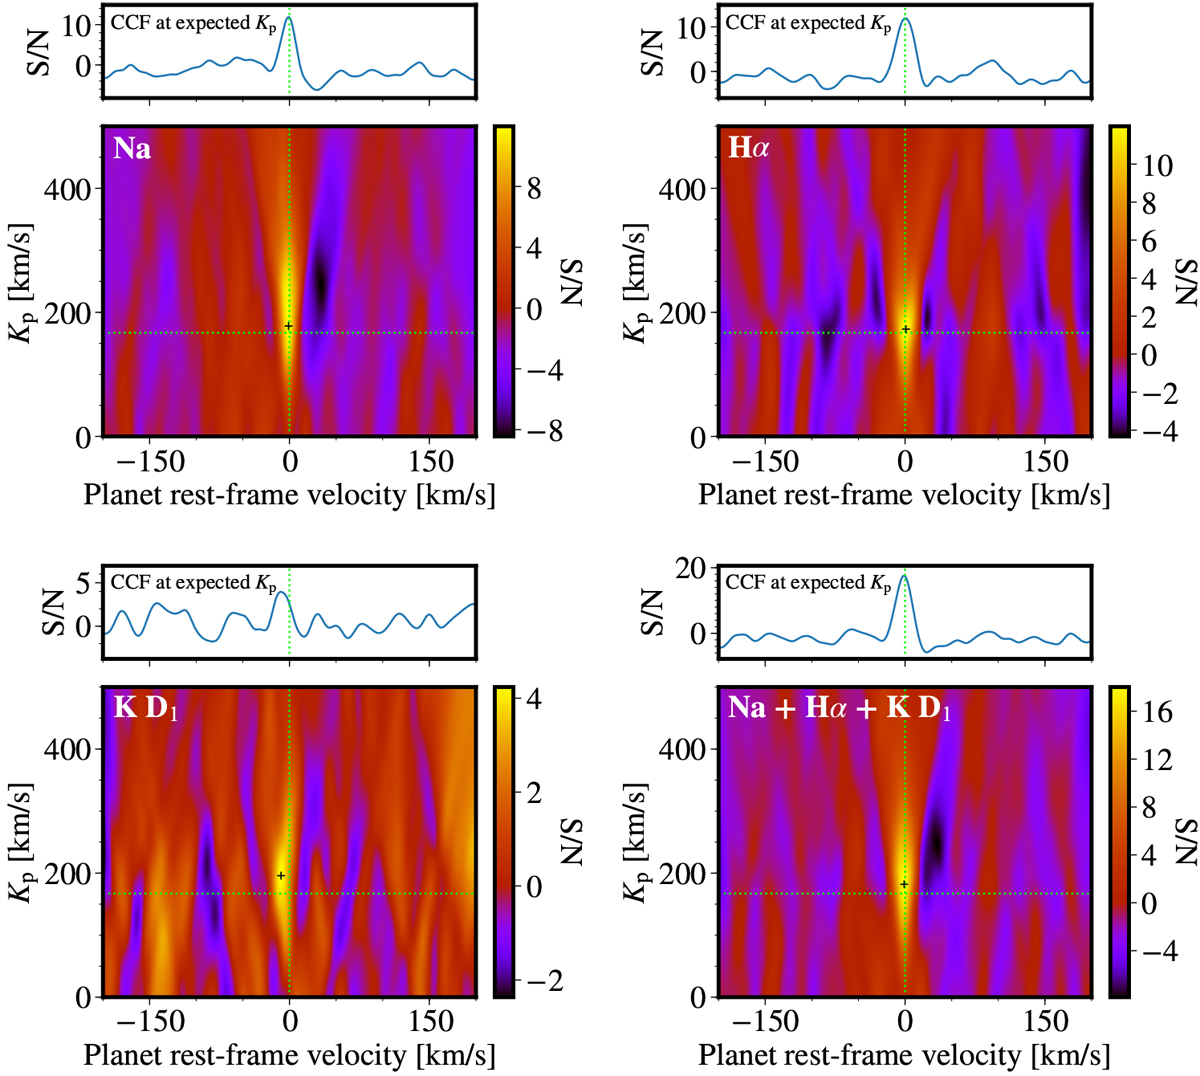
Combined cross-correlation function (CCF) calculated at pairs of Kp and velocity for Na (top left), Hα (top right), K D1 (bottom left), and Na+Hα+K D1 combined (bottom right). The CCF has been normalized and expressed in the form of S/N. The plus sign marks the maximum S/N location. The dotted lines refer to Kp = 167 km s−1 and zero velocity. The sub-panel above the Kp map shows the normalized CCF at Kp = 167 km s−1.
Current usage metrics show cumulative count of Article Views (full-text article views including HTML views, PDF and ePub downloads, according to the available data) and Abstracts Views on Vision4Press platform.
Data correspond to usage on the plateform after 2015. The current usage metrics is available 48-96 hours after online publication and is updated daily on week days.
Initial download of the metrics may take a while.