Fig. 5
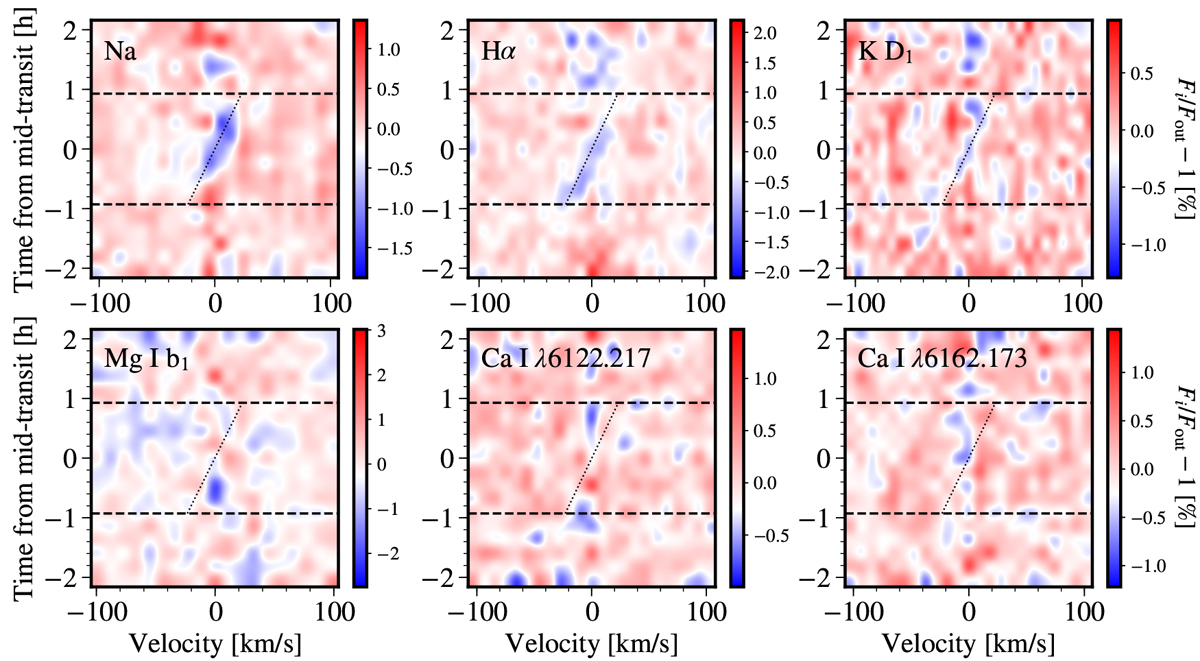
Phase-resolved transmission spectrum at the Na, Hα, K D1 lines (top row), and three of the control lines (bottom row). Signatures arising from the center-to-limb variation and Rossiter-McLaughlin effects have been corrected. Three nights have been combined and rebinned to the phase and velocity grid. Dashed lines mark the first and fourth contacts of the transit. Slanted dotted lines indicate the radial velocity shift induced by the planet orbital motion at the expected radial velocity semi-amplitude Kp = 167 km s−1. Top row: excess absorption (traced in blue color) with a velocity shift during the transit, which agrees with the expected planet orbital motion; bottom row: does not exhibit any significant excess absorption with a regular velocity shift.
Current usage metrics show cumulative count of Article Views (full-text article views including HTML views, PDF and ePub downloads, according to the available data) and Abstracts Views on Vision4Press platform.
Data correspond to usage on the plateform after 2015. The current usage metrics is available 48-96 hours after online publication and is updated daily on week days.
Initial download of the metrics may take a while.