Fig. 4
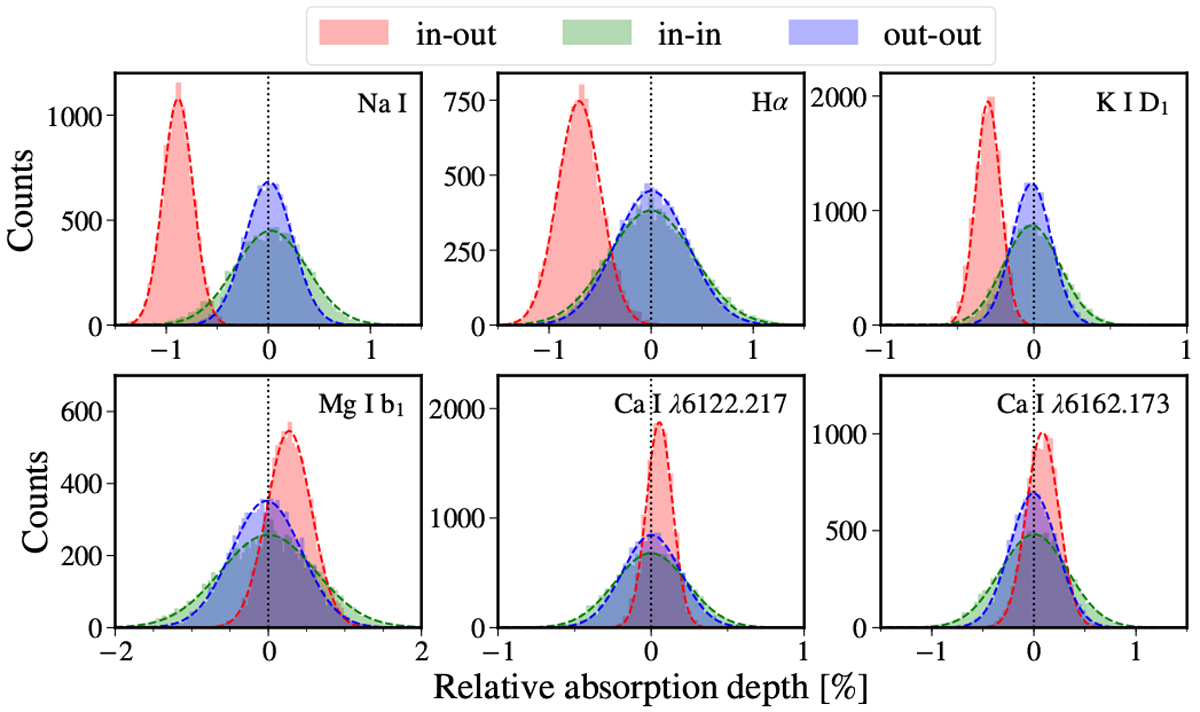
Distribution of absorption depths from the empirical Monte Carlo (EMC) simulation at the Na doublet, Hα, and K D1 lines, along with three control lines (Mg I 5183.604 Å, Ca I 6122.217 Å, Ca I 6162.173 Å). The control lines are sensitive to stellar activity. The absorption depths are measured in two 0.4 Å passbands for Na doublet, a 0.35 Å passband forHα, a 0.55 Å passband forK D1, and a 0.4 Å passband for the three control lines, respectively. The red, green, and blue distributions correspond to the “in-out”, “in-in”, and “out-out” scenarios detailed in Sect. 4.3, respectively.
Current usage metrics show cumulative count of Article Views (full-text article views including HTML views, PDF and ePub downloads, according to the available data) and Abstracts Views on Vision4Press platform.
Data correspond to usage on the plateform after 2015. The current usage metrics is available 48-96 hours after online publication and is updated daily on week days.
Initial download of the metrics may take a while.