Fig. 2
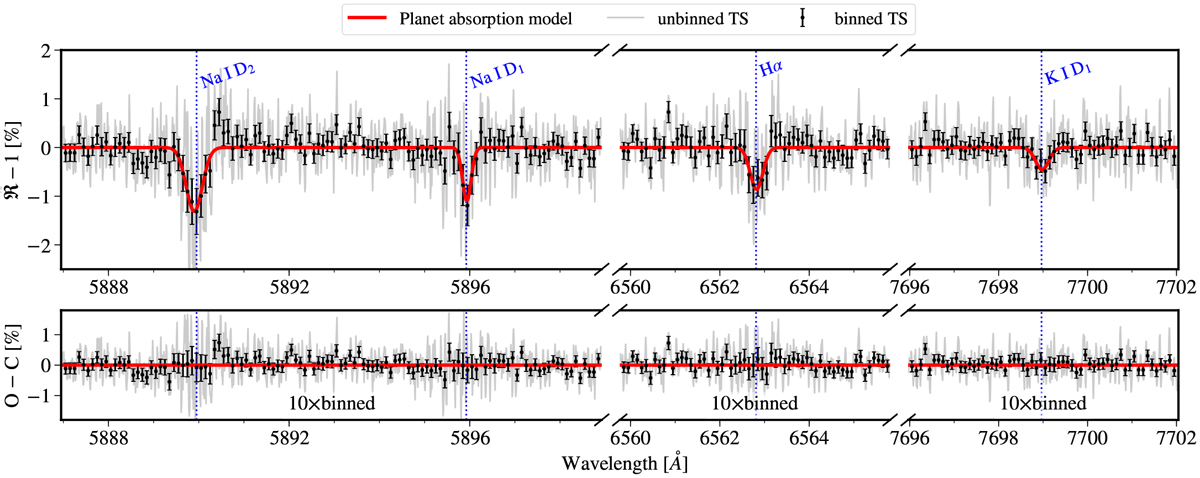
Top row: transmission spectrum of WASP-52b observed by ESPRESSO at the Na doublet, Hα, and K D1 lines. Signatures arising from the center-to-limb variation and Rossiter–McLaughlin effects have been corrected. The gray line shows the unbinned transmission spectrum in grids of 0.01 Å. The black circles are binned into intervals of 0.1 Å (i.e., 10 × binned). The red lineshows the best-fit planet absorption model. The error bars show the propagated photon noise. Bottom row: best-fit residuals.
Current usage metrics show cumulative count of Article Views (full-text article views including HTML views, PDF and ePub downloads, according to the available data) and Abstracts Views on Vision4Press platform.
Data correspond to usage on the plateform after 2015. The current usage metrics is available 48-96 hours after online publication and is updated daily on week days.
Initial download of the metrics may take a while.