Fig. 1
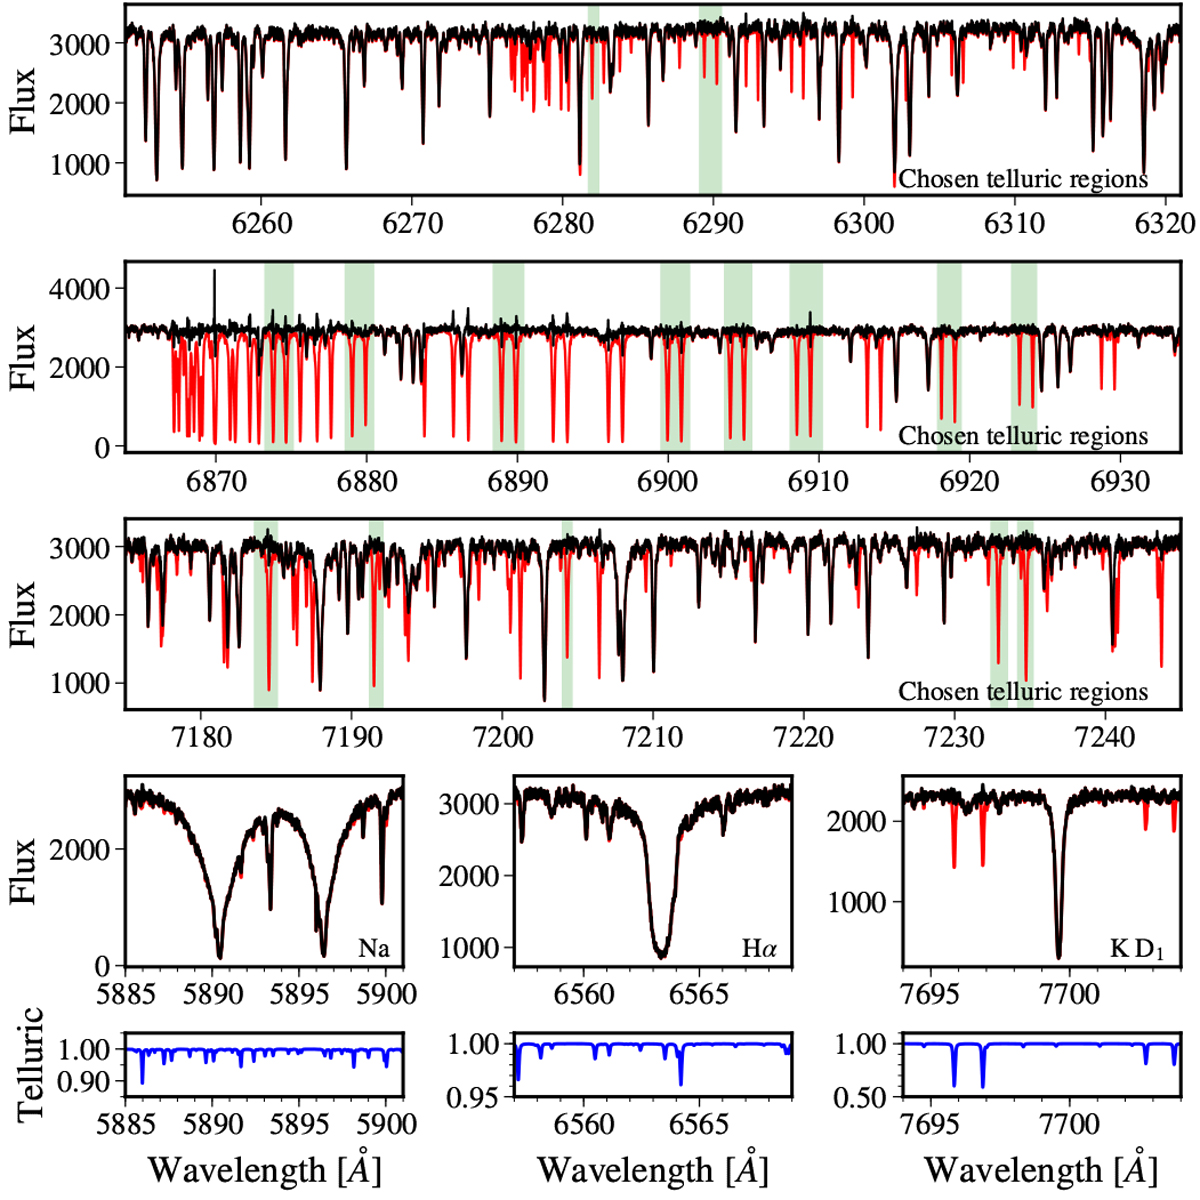
Illustration of telluric correction by molecfit. Top four rows: example spectrum before (red line) and after (black line) the telluric correction. Top three rows: fifteen telluric regions (green shaded areas) to fit for the telluric absorption. Fourth row: correction at the Na, Hα, and K lines. Bottom row: telluric correction applied in the fourth row.
Current usage metrics show cumulative count of Article Views (full-text article views including HTML views, PDF and ePub downloads, according to the available data) and Abstracts Views on Vision4Press platform.
Data correspond to usage on the plateform after 2015. The current usage metrics is available 48-96 hours after online publication and is updated daily on week days.
Initial download of the metrics may take a while.