Fig. 2.
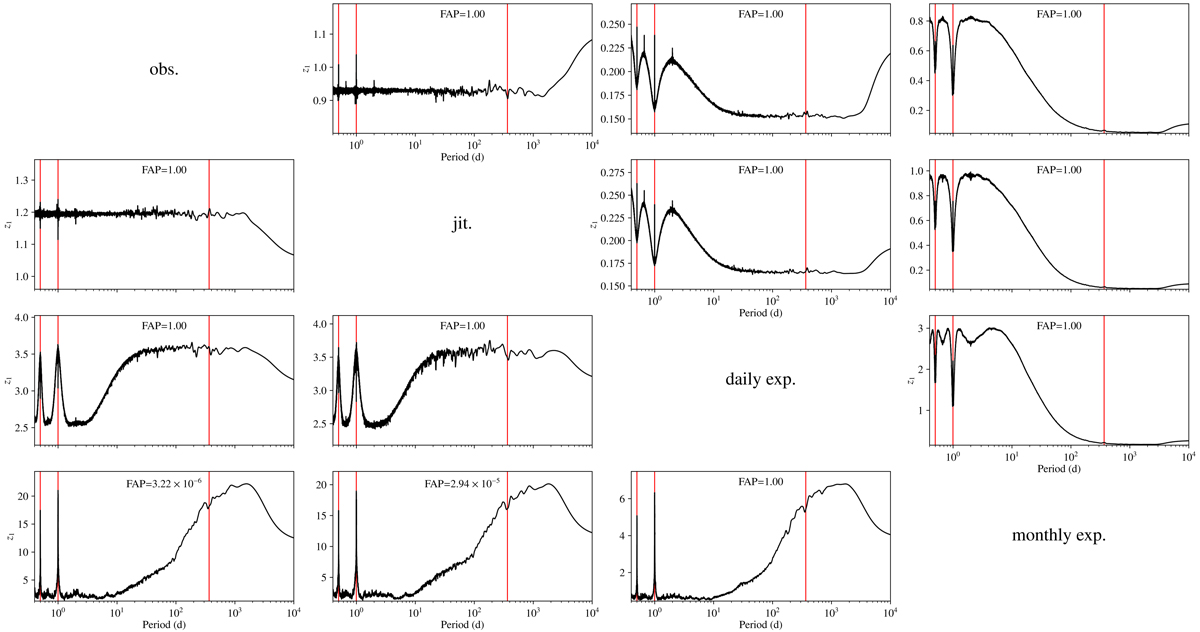
Periodogram expectation for HD 136352 in the case of a wrong noise model (see Eq. (B.9)). Rows correspond to the true noise model, while columns correspond to the assumed wrong model. The definition z1 of the periodogram power is used (see Eq. (4)). If the noise model was correct, the expectation of the periodogram power would be uniformly 1 (see Eq. (B.10)). The red vertical lines highlight 0.5 d, 1 d, and 1 yr. For each periodogram, we provide the analytical estimate of the FAP (using the wrong noise model) corresponding to the highest peak of the periodogram expectation.
Current usage metrics show cumulative count of Article Views (full-text article views including HTML views, PDF and ePub downloads, according to the available data) and Abstracts Views on Vision4Press platform.
Data correspond to usage on the plateform after 2015. The current usage metrics is available 48-96 hours after online publication and is updated daily on week days.
Initial download of the metrics may take a while.