Fig. 4
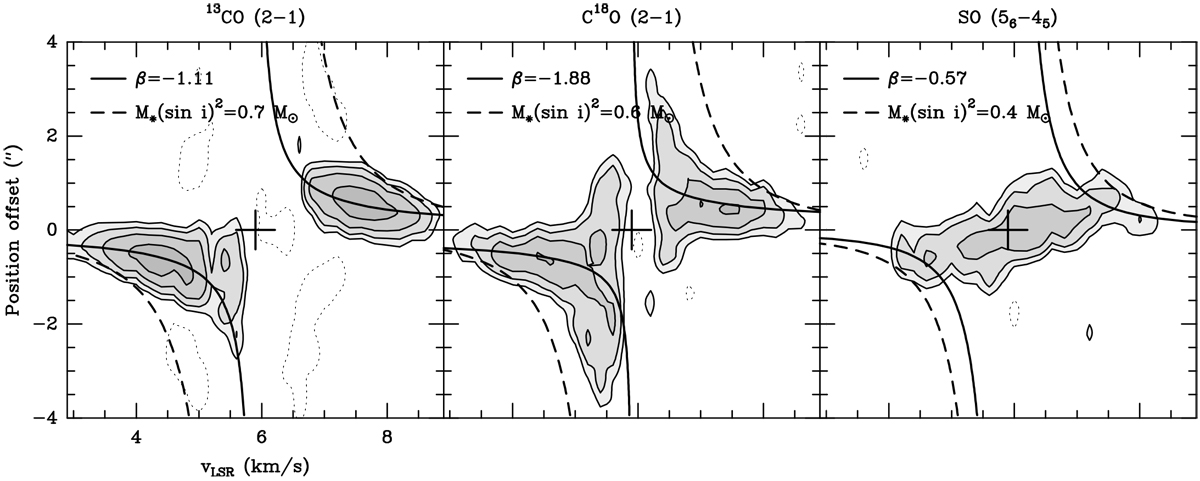
Position velocity cuts in the image plane through the L1527 continuum peak along the assumed disk major axis for the 13 CO (2−1) (left panel), C18O (2−1) (middle panel), and SO (56−45) (right panel)lines. Contours are drawn at −3σ, 3σ, 6σ, 12σ
and so on. Black crosses correspond to the continuum peak. Black solid curves show the results of the velocity fit in the
uv
plane with a power-law function. Dashed lines show the result of the fit of the 6σ
contours with a Keplerian law with ![]() ,
,
![]() , and
, and ![]() for the 13 CO (2−1),
C18O (2−1), and SO (56−45) lines, respectively.
for the 13 CO (2−1),
C18O (2−1), and SO (56−45) lines, respectively.
Current usage metrics show cumulative count of Article Views (full-text article views including HTML views, PDF and ePub downloads, according to the available data) and Abstracts Views on Vision4Press platform.
Data correspond to usage on the plateform after 2015. The current usage metrics is available 48-96 hours after online publication and is updated daily on week days.
Initial download of the metrics may take a while.