Fig. D.3
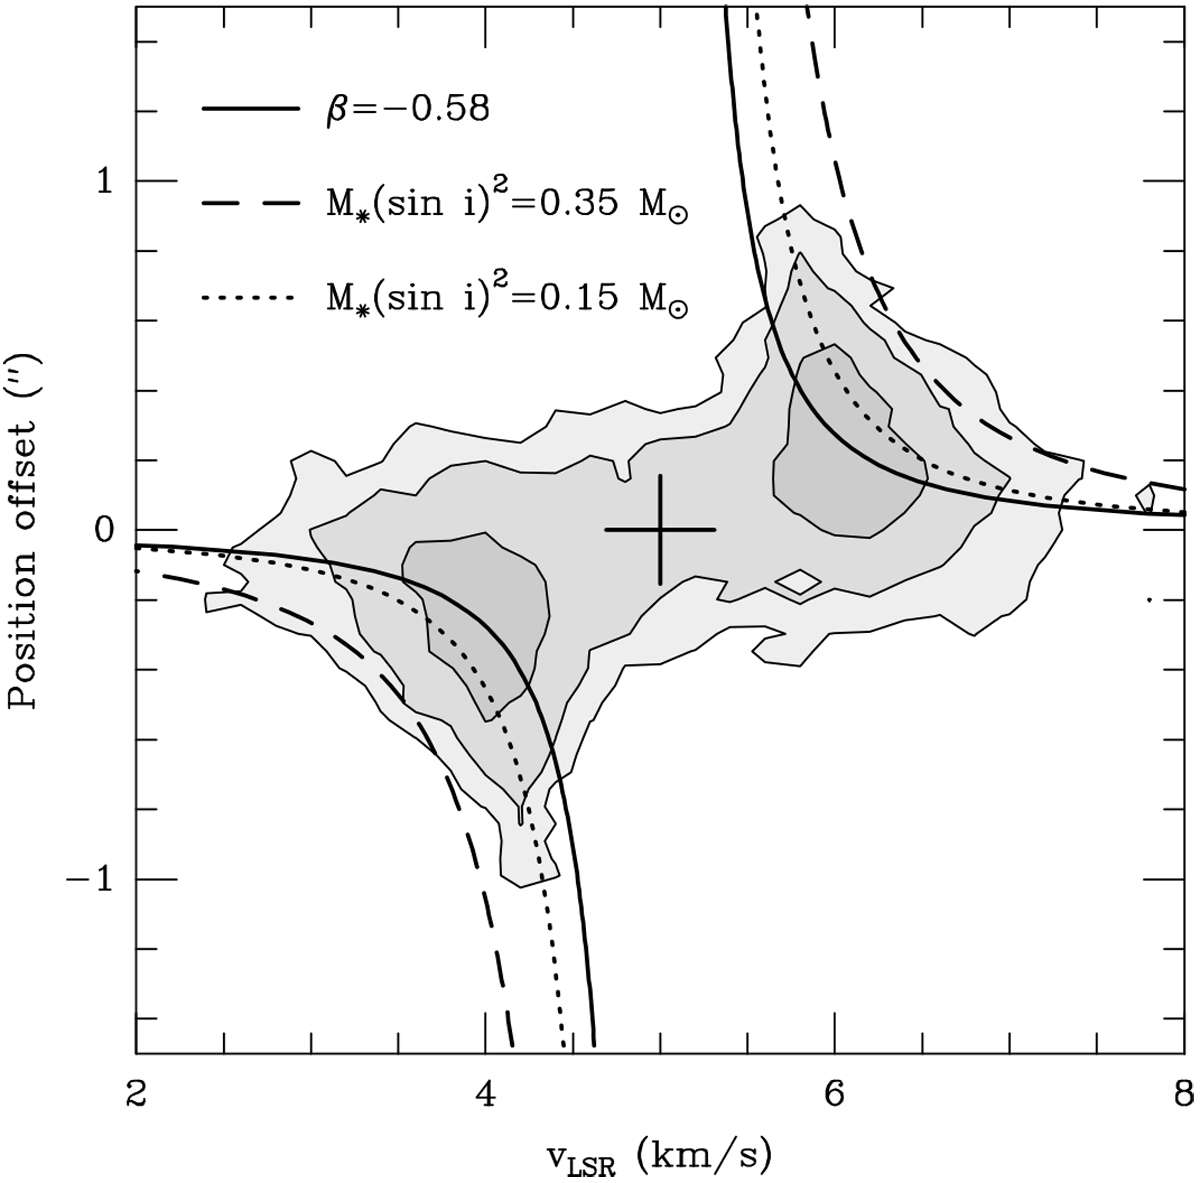
PVdiagram along the disk major axis for the synthetic disk model. The solid line shows the velocity curve obtained from a fit in the uv
plane (see the solid curve in Fig. D.2). The dashed line shows a fit of the first emission contour with a Keplerian law for ![]() , that is, M⋆ = 0.7 M⊙. The dotted line shows the Keplerian law for the underlying disk model, with
, that is, M⋆ = 0.7 M⊙. The dotted line shows the Keplerian law for the underlying disk model, with
![]() , that is, M⋆ = 0.3 M⊙.
, that is, M⋆ = 0.3 M⊙.
Current usage metrics show cumulative count of Article Views (full-text article views including HTML views, PDF and ePub downloads, according to the available data) and Abstracts Views on Vision4Press platform.
Data correspond to usage on the plateform after 2015. The current usage metrics is available 48-96 hours after online publication and is updated daily on week days.
Initial download of the metrics may take a while.