Fig. 2
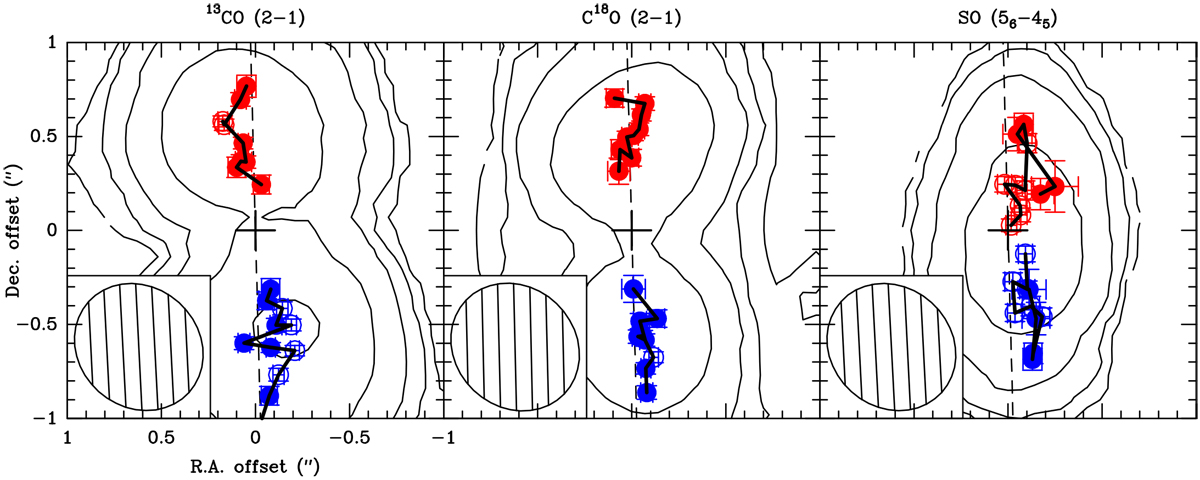
Results of the fits in the uv plane for each spectral channel (circles with error bars) superimposed on zeroth-order moment map (black contours) in L1527 for the 13CO (2−1) (left panel), C18O (2−1) (middle panel), and SO (56−45) (right panel)lines. Contours are drawn at 3σ, 6σ, 12σ, and so on. Blue and red points show the centroid positions of the blue-shifted and red-shifted channels, respectively. Only filled points are considered when constructing the velocity curves; open points are ignored. The thick black lines connect the centroids that correspond to adjacent velocity channels. Black crosses show the position of the continuum peak, while the dashed line shows the assumed disk major axis.
Current usage metrics show cumulative count of Article Views (full-text article views including HTML views, PDF and ePub downloads, according to the available data) and Abstracts Views on Vision4Press platform.
Data correspond to usage on the plateform after 2015. The current usage metrics is available 48-96 hours after online publication and is updated daily on week days.
Initial download of the metrics may take a while.