Fig. 1
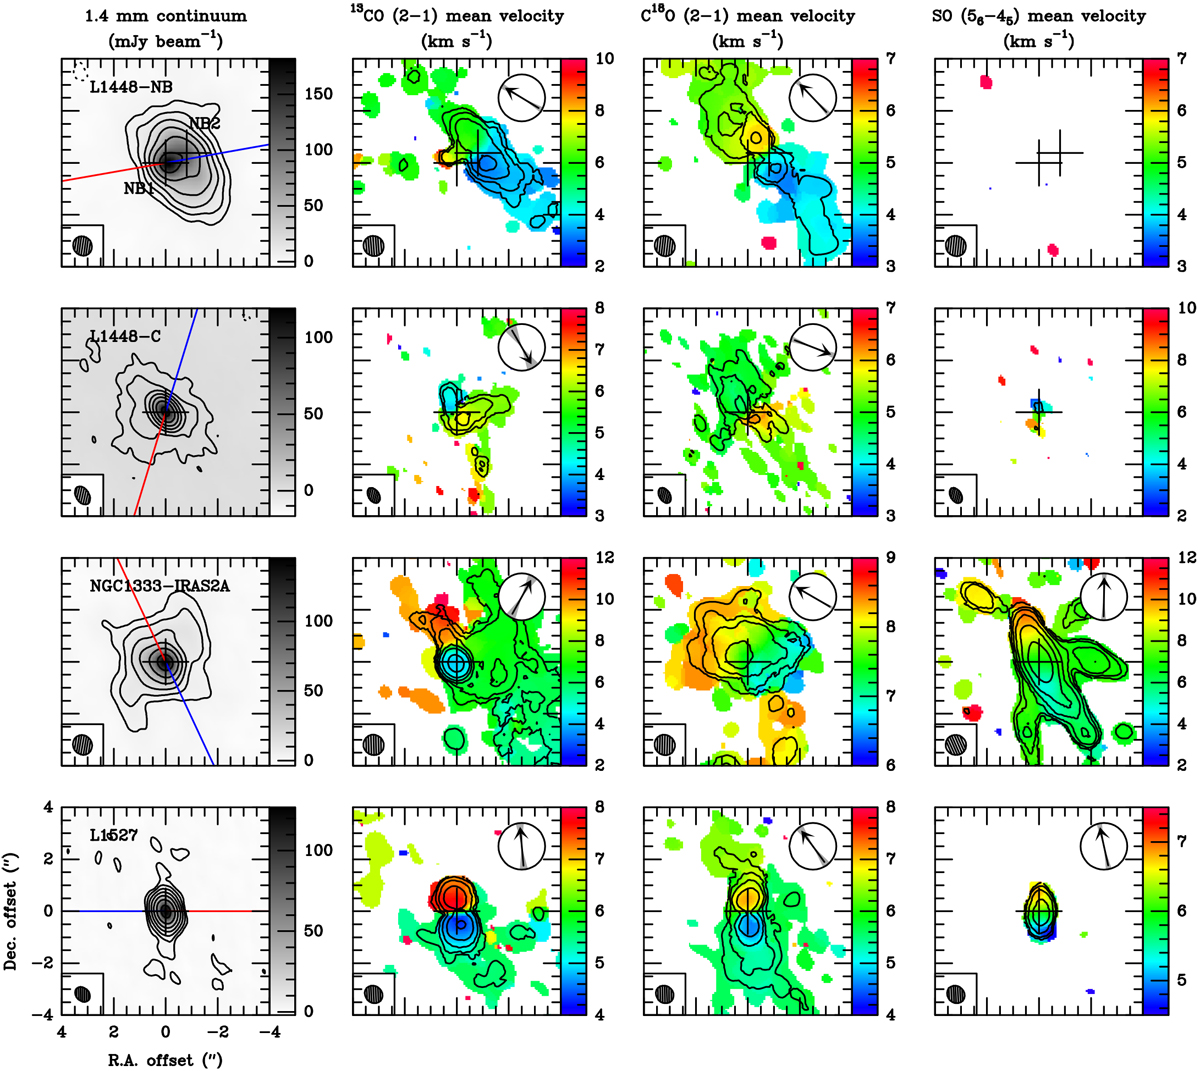
1.4 mm continuum emission, integrated intensities and mean velocities of the 13CO (2−1), C18O (2−1) and SO (56−45) lines in L1448-NB, L1448-C, NGC 1333-IRAS 2A, and L1527. Left panels: the 1.4 mm continuum emission. Other panels: the line mean velocities (first-order moment; background image), together with theline integrated intensities (zeroth-order moment; black contours). Contours are drawn at −3σ (dotted lines) 3σ, 6σ, 12σ and so on (solid lines). In each panel, the black crosses show the position of the main continuum peak(s). The blue and red lines in the left panels indicate the direction of the blue- and red-shifted lobes of the jet(s), respectively. The arrows in other panels indicate the direction of the velocity gradient, as determined from a linear fit of the mean velocity within 2″ of the continuum peak position. The gray sectors around each arrow show the 1σ uncertainty on the direction of the velocity gradient. The ellipse in each panel shows the synthesized beam. All coordinates are relative to the positions of the brightest continuum peak of each source (see Table 1).
Current usage metrics show cumulative count of Article Views (full-text article views including HTML views, PDF and ePub downloads, according to the available data) and Abstracts Views on Vision4Press platform.
Data correspond to usage on the plateform after 2015. The current usage metrics is available 48-96 hours after online publication and is updated daily on week days.
Initial download of the metrics may take a while.