Fig. 4.
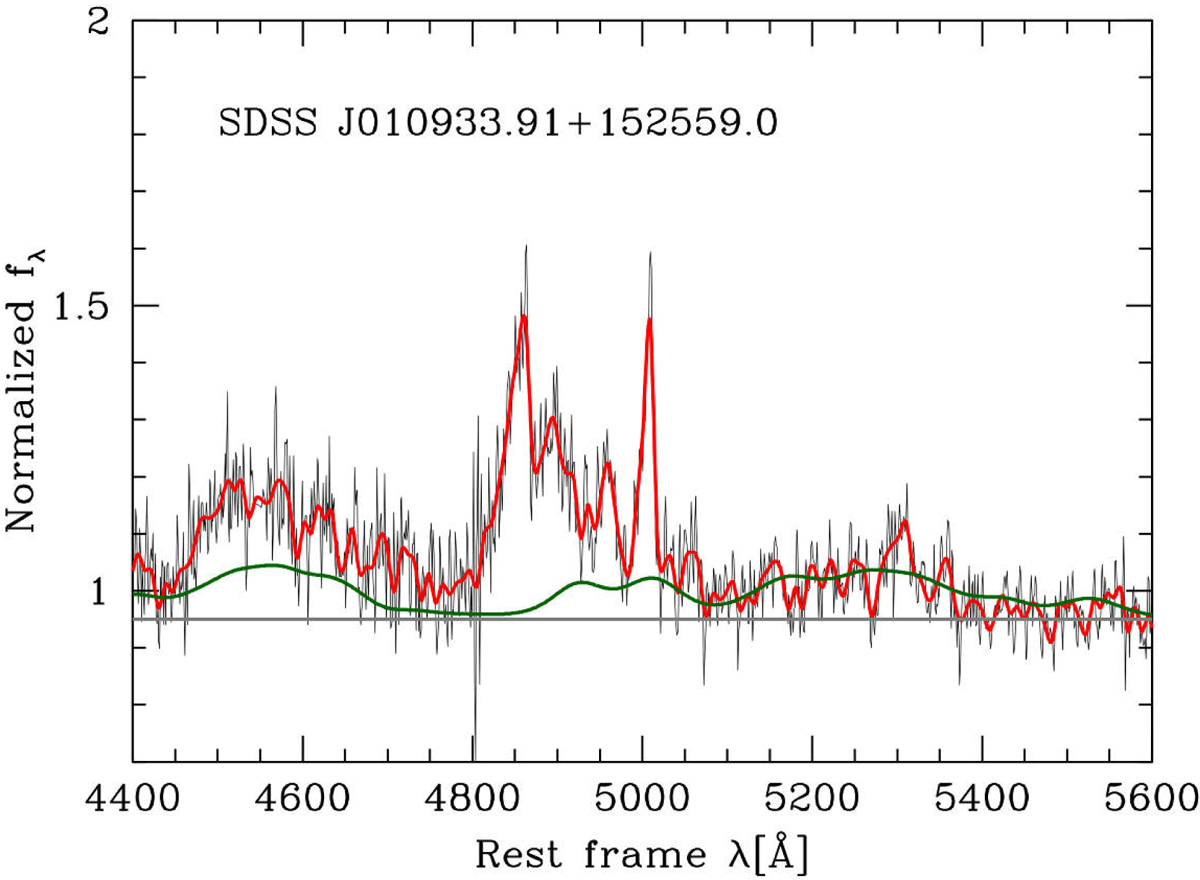
Example of rest-frame spectrum whose features are misinterpreted because of heavy contamination by the absorption spectrum of the host galaxy and because of insufficient spectral coverage. The spectrum is shown with the original SDSS resolution (thin black line) and after rebinning to model data with significantly lower resolution (thick red line). The flat continuum (gray line) erroneously suggests a significant deviation from the Fe II template (dark green line).
Current usage metrics show cumulative count of Article Views (full-text article views including HTML views, PDF and ePub downloads, according to the available data) and Abstracts Views on Vision4Press platform.
Data correspond to usage on the plateform after 2015. The current usage metrics is available 48-96 hours after online publication and is updated daily on week days.
Initial download of the metrics may take a while.