Fig. 3.
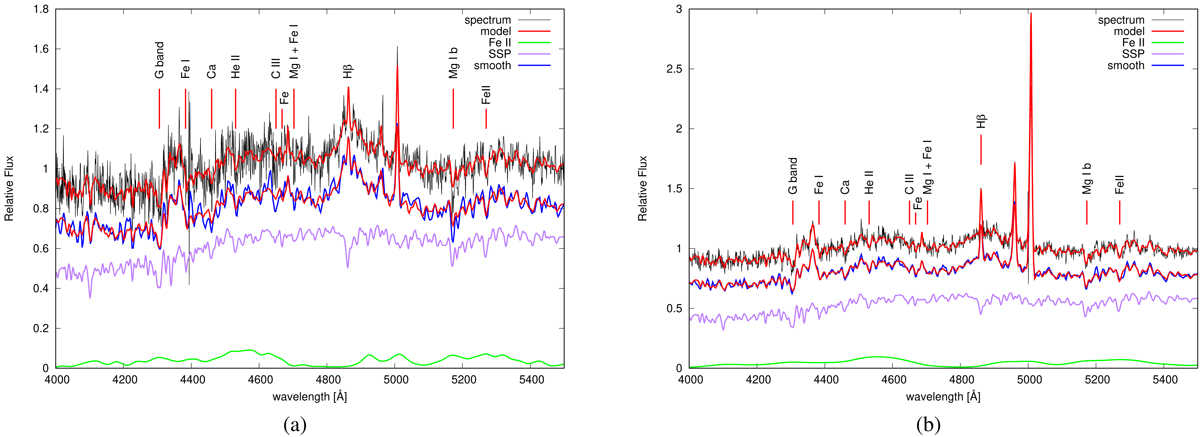
Examples of spectra (J092620.62+101734.8 and J113651.66+445016.4, respectively) from our sample where the host galaxy mimics strong Fe II emission, leading to a mistaken identification of strong FeII emitters. Spectra on the plots (a) and (b) have a widely different S/N. The panels show as follows (from top to bottom): the real spectra and the best fitting model; the smoothed spectra overlapped with the best fitting model; single stellar population spectra that were used in the best fitting model; and the Fe II template used in the fit. Some prominent absorption lines are marked on the plots.
Current usage metrics show cumulative count of Article Views (full-text article views including HTML views, PDF and ePub downloads, according to the available data) and Abstracts Views on Vision4Press platform.
Data correspond to usage on the plateform after 2015. The current usage metrics is available 48-96 hours after online publication and is updated daily on week days.
Initial download of the metrics may take a while.