Fig. B.2.
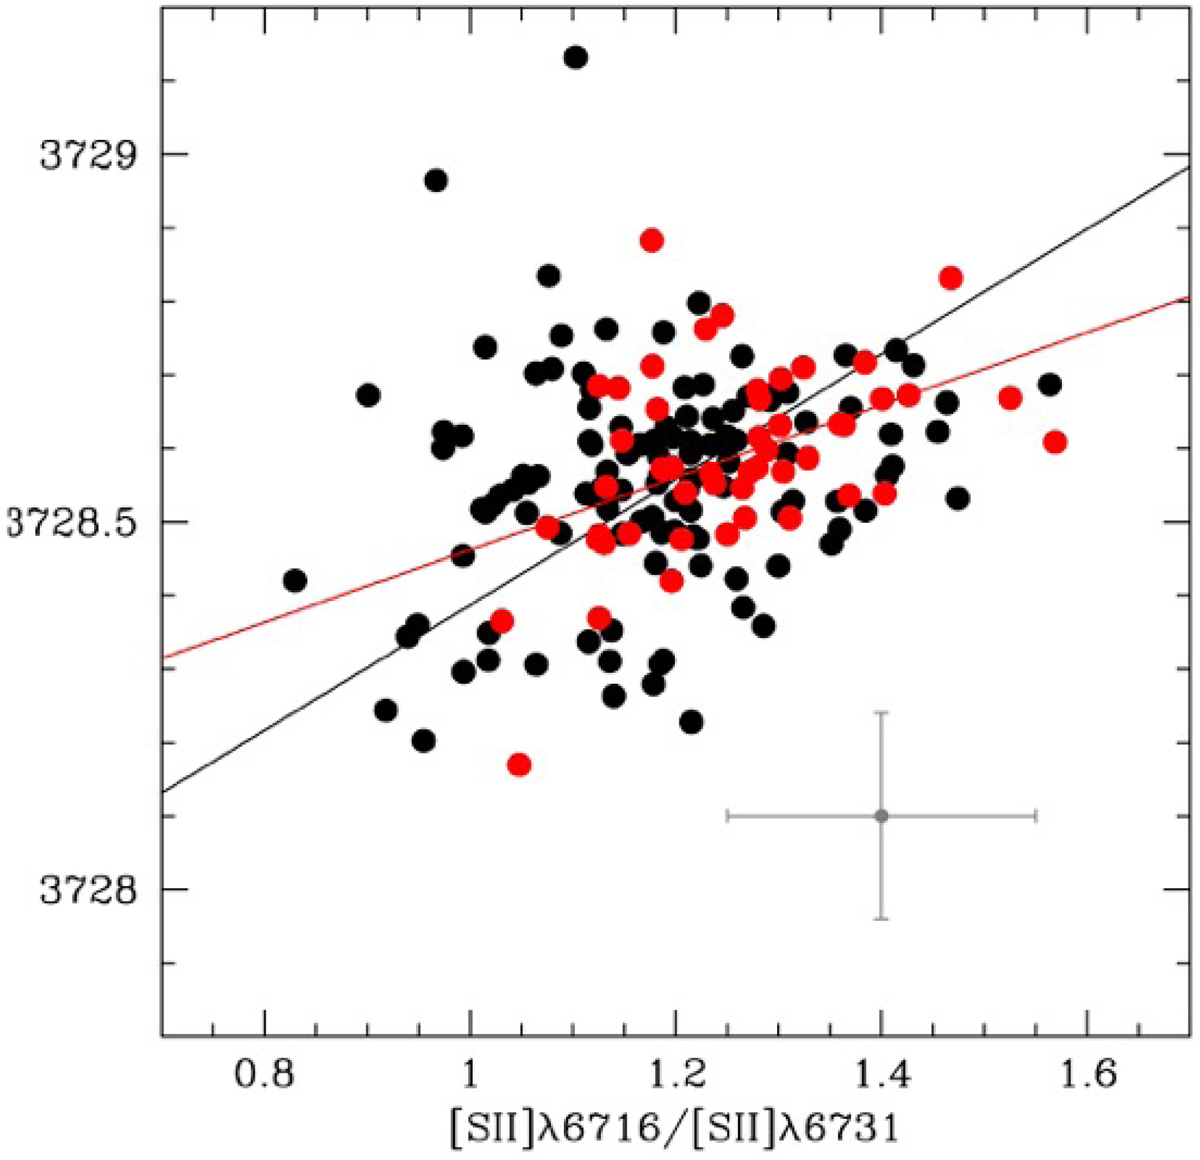
Relation between the [O II]λ3727 effective wavelength λeff and the R[SII] intensity ratio for a sample of HII regions. Red circles refer to a vetted subsample in which the uncertainty in the [S II]λλ6731,6717 doublet ratio R is less than 10%. Best fitting lines are obtained with the bisector method (full sample, black line) and with an unweighted least square fit (vetted sample, blue line). Typical errors are δλeff ≈ ±0.15 Å for the effective wavelength and δR[SII] ≈ ± 0.15 for the [S II]λλ6731,6717 ratio.
Current usage metrics show cumulative count of Article Views (full-text article views including HTML views, PDF and ePub downloads, according to the available data) and Abstracts Views on Vision4Press platform.
Data correspond to usage on the plateform after 2015. The current usage metrics is available 48-96 hours after online publication and is updated daily on week days.
Initial download of the metrics may take a while.