Free Access
Fig. A.2.
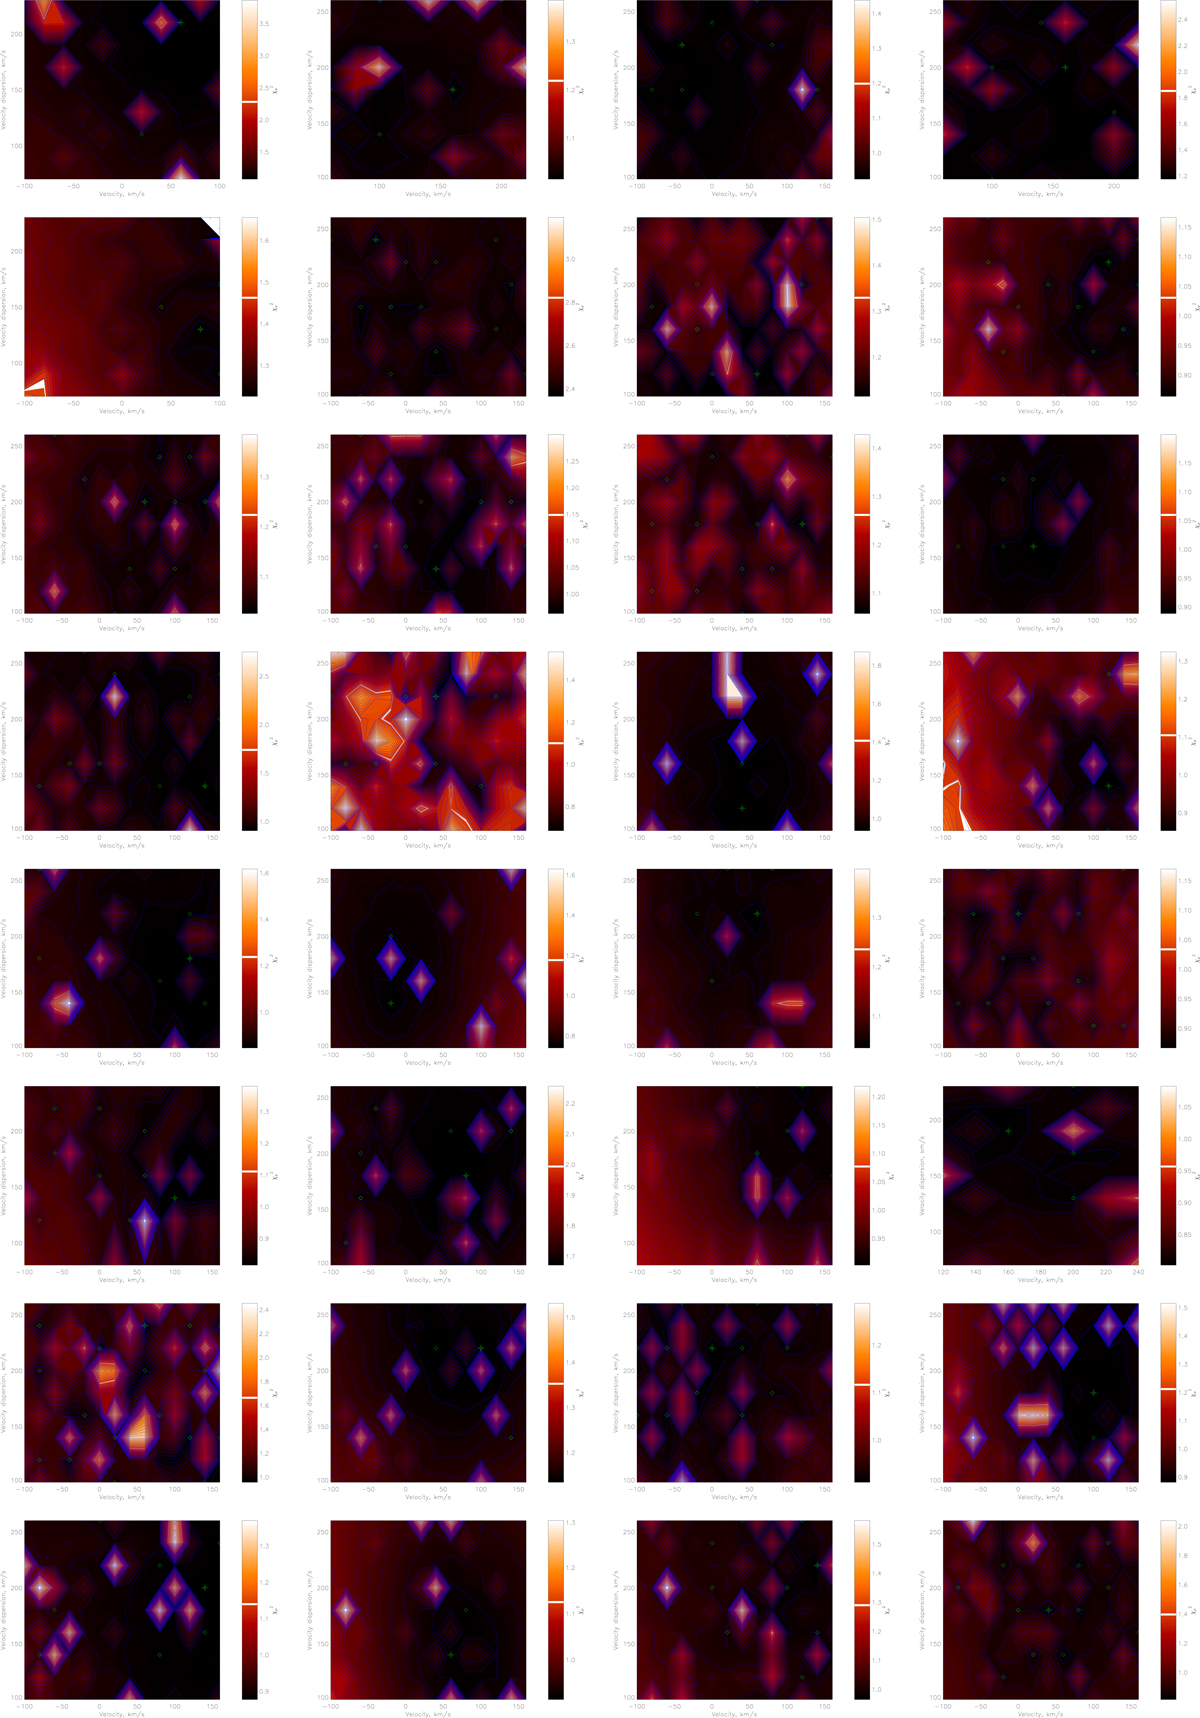
χ2 maps in the space of SSP mean stellar velocity and SSP velocity dispersion. Color-bar on the right hand side of χ2 maps show χ2 value normalized for the S/N value of the spectrum, which was measured by the SDSS in the g-band.
Current usage metrics show cumulative count of Article Views (full-text article views including HTML views, PDF and ePub downloads, according to the available data) and Abstracts Views on Vision4Press platform.
Data correspond to usage on the plateform after 2015. The current usage metrics is available 48-96 hours after online publication and is updated daily on week days.
Initial download of the metrics may take a while.