Fig. A.1.
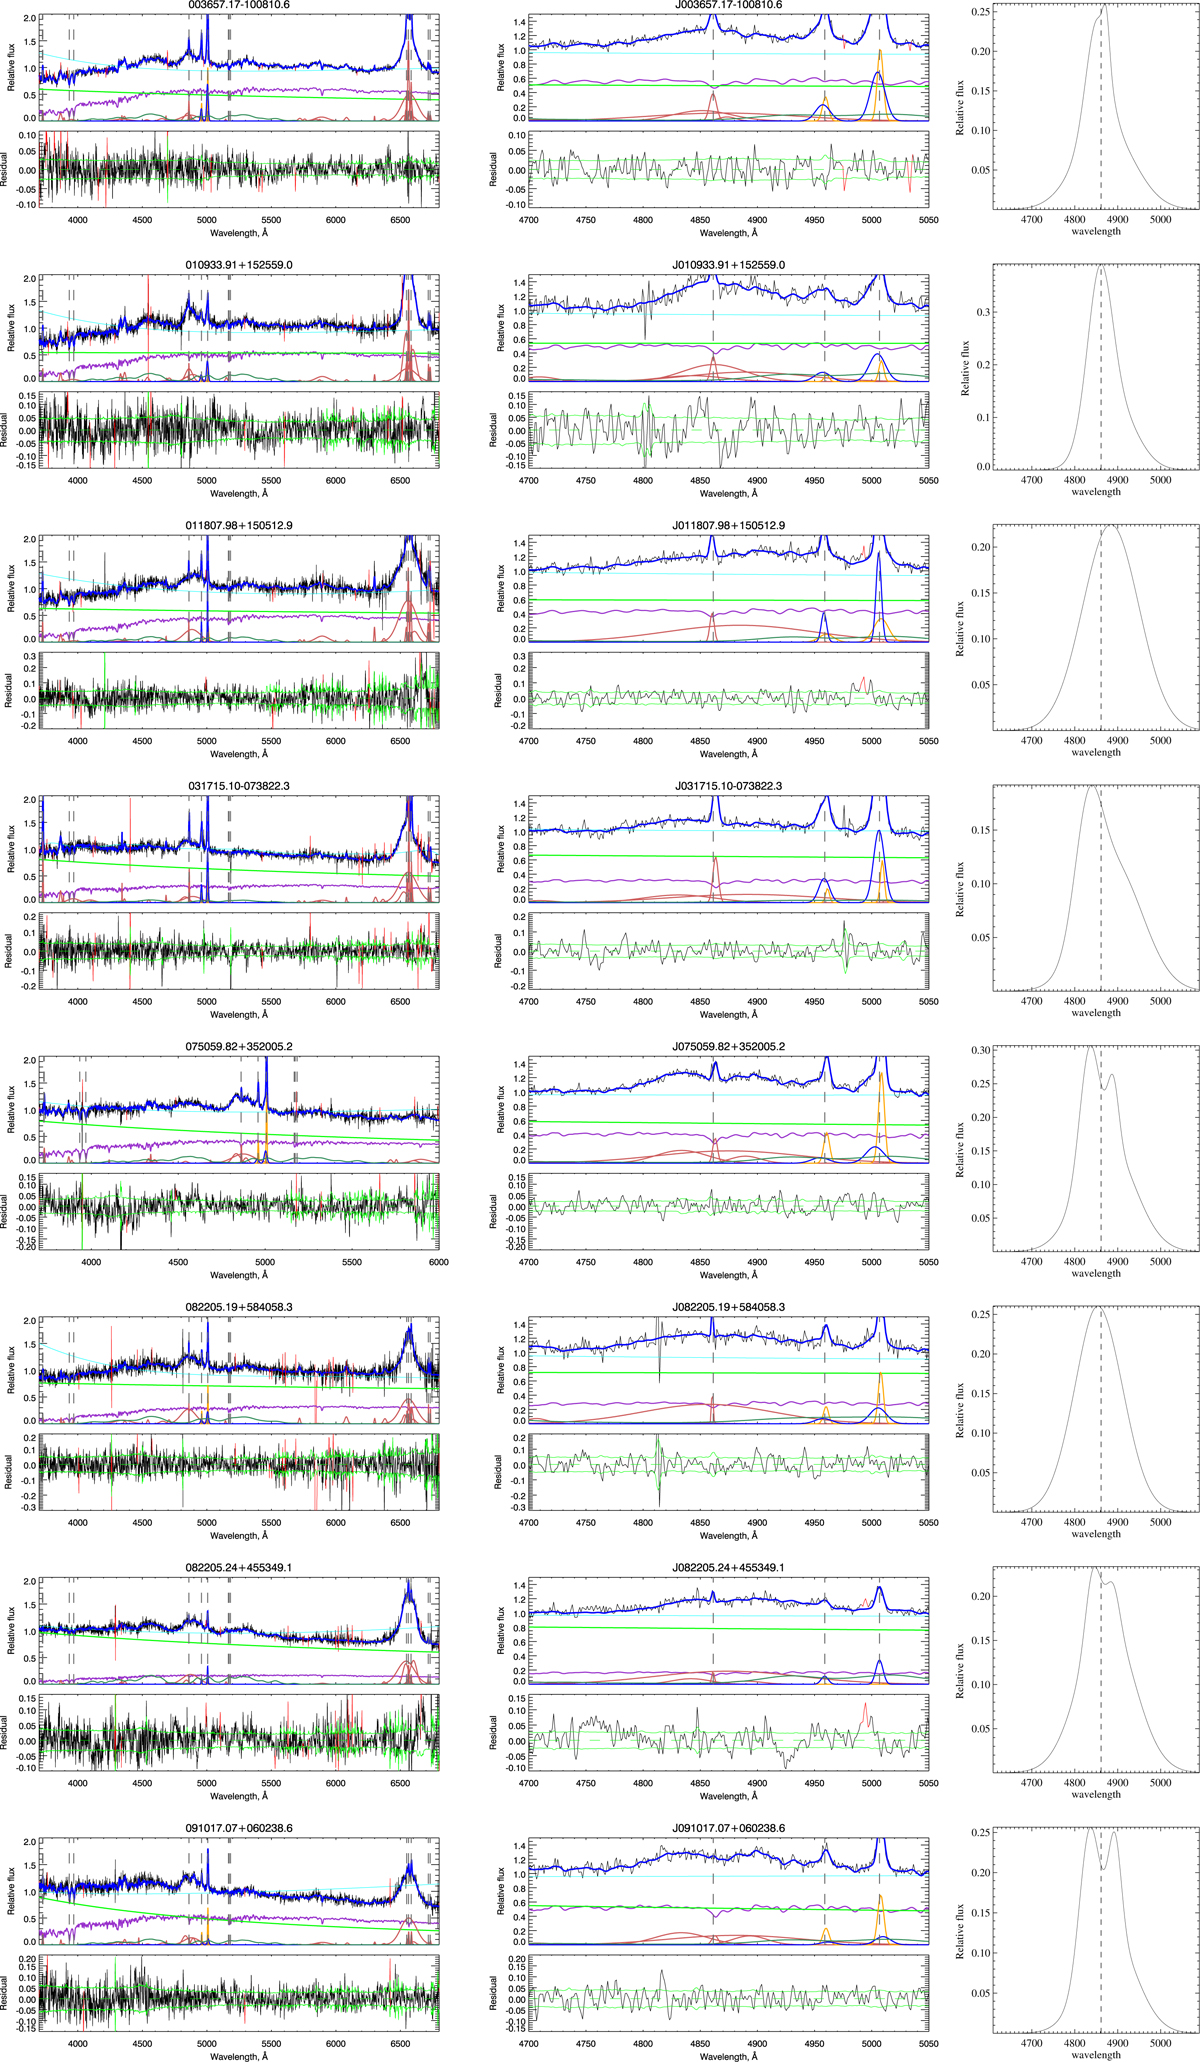
ULySS fits to the HG sample. In the upper left panel, the black line represents the observed spectrum, the blue one represents the best fit, the red line represents the multiplicative polynomial, while the green, light red, and violet lines represent components of the best fit: violet is the stellar population, red is the emission lines, and green is the AGN continuum. Bottom left panel: residuals of the best fit (black line). The green solid line shows the level of the noise, and the dashed line is the zero-axis. Middle panels: zoom the domain around Hβ and [O III]λ5007 lines, while panels on the right hand side show the model broad Hβ.
Current usage metrics show cumulative count of Article Views (full-text article views including HTML views, PDF and ePub downloads, according to the available data) and Abstracts Views on Vision4Press platform.
Data correspond to usage on the plateform after 2015. The current usage metrics is available 48-96 hours after online publication and is updated daily on week days.
Initial download of the metrics may take a while.