Fig. 1.
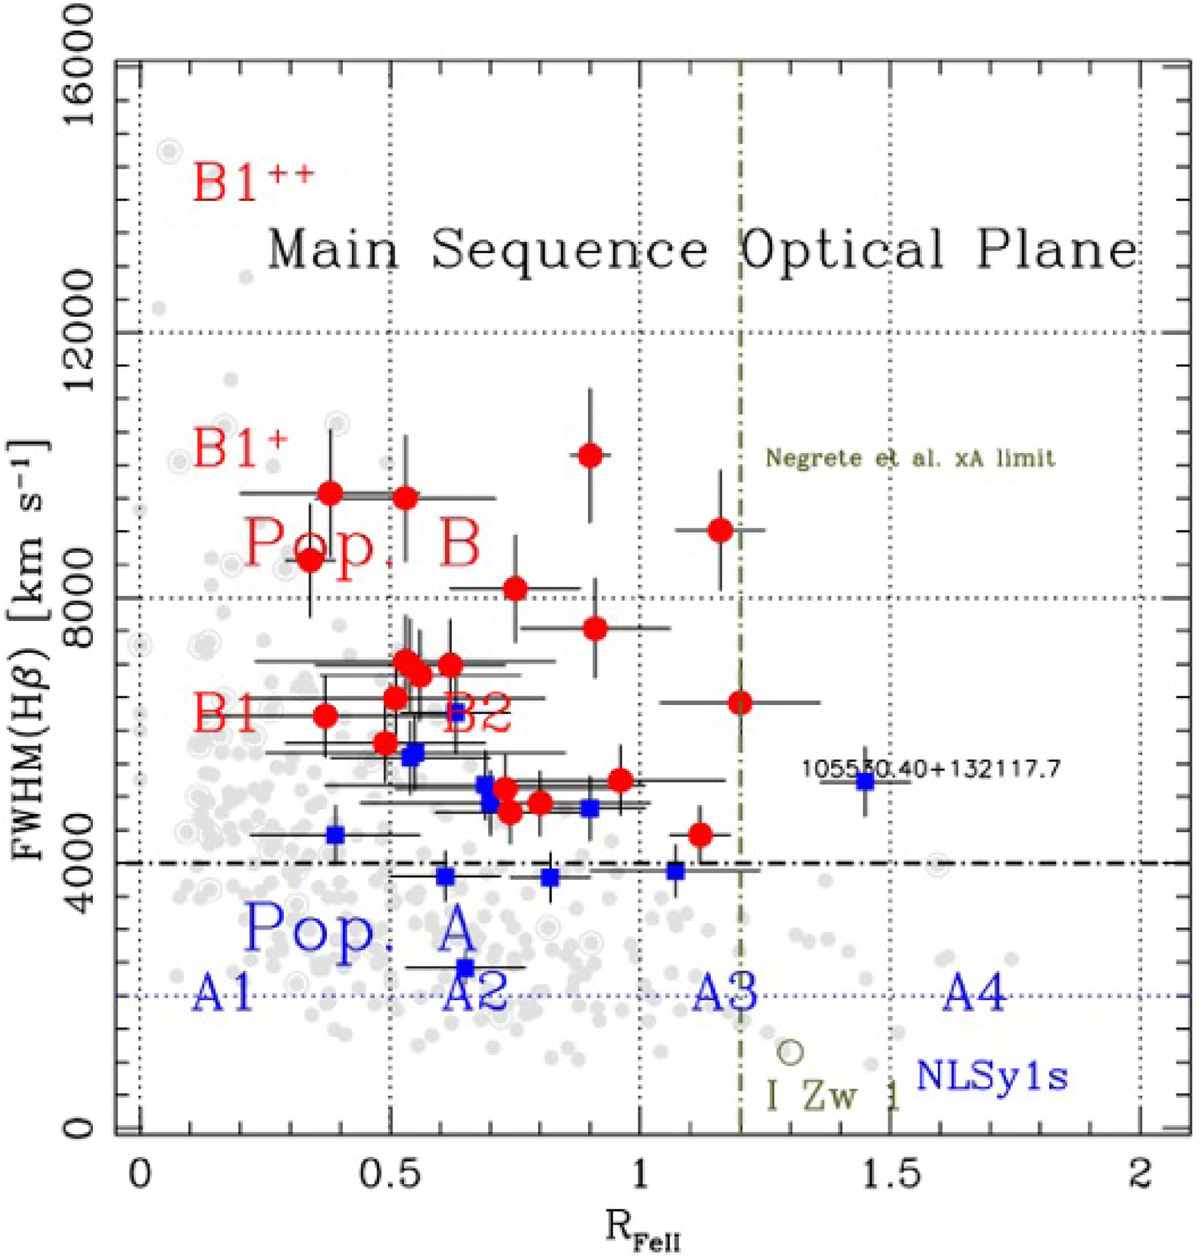
Optical plane of the E1 MS, FWHM HβBC vs. RFeII. Sources from our sample are represented as red and blue circles; the gray symbols represent the MS from the sample of Zamfir et al. (2010), with RL sources identified by an outer circle. The red circles are sources with the D parameter larger than 1.5; for the blue squares D ≲ 1.5. The horizontal dot-dashed line marks the limit between Population A and at FWHM = 4000 km s−1 . Dotted lines separate spectral types and NLSy1s. The vertical dot-dashed olive line identifies the RFeII = 1.2 limit for xA “safe” identification according to Paper I. Only one source qualifies as a true xA candidate. The position of the prototypical xA source I Zw 1 is marked.
Current usage metrics show cumulative count of Article Views (full-text article views including HTML views, PDF and ePub downloads, according to the available data) and Abstracts Views on Vision4Press platform.
Data correspond to usage on the plateform after 2015. The current usage metrics is available 48-96 hours after online publication and is updated daily on week days.
Initial download of the metrics may take a while.