Fig. 5.
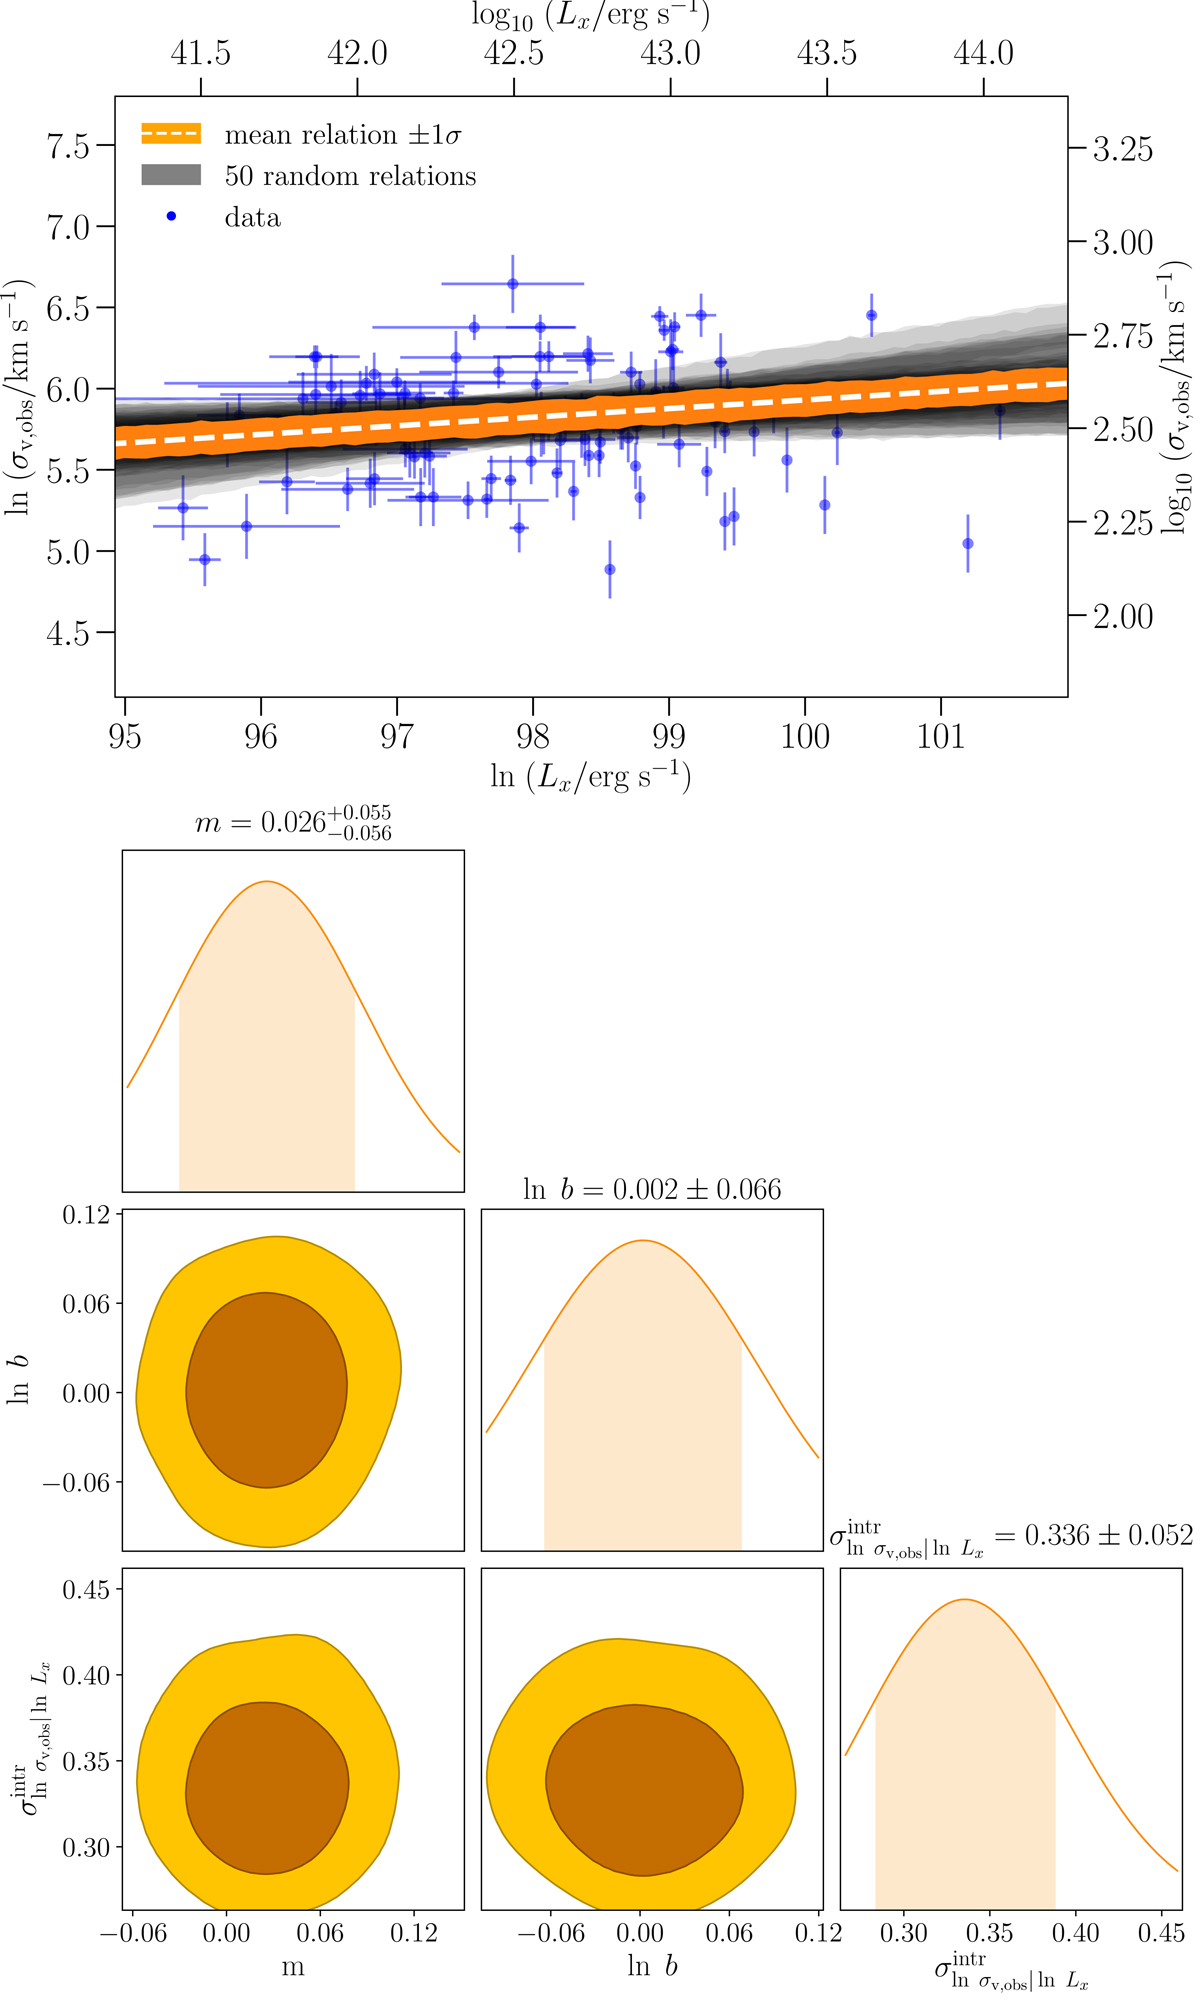
Upper panel: the scaling relation between the natural logarithm of the observed velocity dispersion of groups ln (σv,obs km−1 s) determined using their spec-z members within r200c and the natural logarithm of the X-ray luminosity of groups ln (Lx erg−1 s) at z < 1.0 in COSMOS (blue points with associated errors). We also added axes showing the 10-base logarithmic scale. The highlighted orange area shows ±1σ uncertainties around the mean scaling relation (white dashed line). The black lines are a set of 50 different realisations, drawn from the multivariate Gaussian distribution of the parameters (![]() ) and the scatter covariance matrix is estimated from the MCMC chain. Lower panel: the one- and two dimensional marginalised posterior distributions of parameters of the scaling relation (Eq. (4)), shown as 68% and 95% credible regions.
) and the scatter covariance matrix is estimated from the MCMC chain. Lower panel: the one- and two dimensional marginalised posterior distributions of parameters of the scaling relation (Eq. (4)), shown as 68% and 95% credible regions.
Current usage metrics show cumulative count of Article Views (full-text article views including HTML views, PDF and ePub downloads, according to the available data) and Abstracts Views on Vision4Press platform.
Data correspond to usage on the plateform after 2015. The current usage metrics is available 48-96 hours after online publication and is updated daily on week days.
Initial download of the metrics may take a while.